

Bonnie’s Market Update 4/12/24
04/14/2024
Early in November the S&P 500 index was down 9 consecutive days, a distant memory now after the S&P 500 joined the Dow, Nasdaq, and Russell 2000 making all-time highs, all on the same day, 11/21/16. On the flip side, bonds have been under selling pressure, the 10-yearTreasury note yields have been edging higher, closing at 2.33% on 11/17/16, the highest level since early January. The rate rise is affecting 30 year mortgages, as they rose 0.5% in one week. Also US Municipal Bond yields are rising fast, and investors are moving away from this asset class. Some municipal bond mutual funds have fallen 5% or more in recent weeks. High-yielding stocks were also hit hard especially the consumer staple sector (XLP), after many years of strong gains. Investors are shifting out of bonds and into equities as long term rates are moving higher.
Stocks could move higher into year-end as the most favorable seasonal period is upon us. Our trading models are in a neutral-positive condition, suggesting downside risk is limited. Expect volume to be light as the holiday season moves on. There could be some potential intraday volatility as investors and institutions rebalance their portfolios, selling weak stocks to offset their gains for tax purposes. Before you take time off for the holiday season, it’s a good time to review your portfolio holdings and make sure you are not overly exposed to hi yielding dividend paying stocks or bonds that are susceptible to higher interest rates. Although they are oversold in the near term, they don’t appear to be where the money is flowing.
Here are some sectors that have risen sharply since the election that investors are buying, and are gaining in relative strength.
Some examples are:
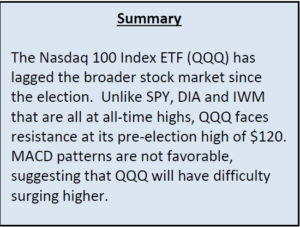
The above sectors have all broken out through their respective weekly channels. Some other sectors have made new highs but have not broken out signaling a potential new leg up. A perfect example is the Nasdaq 100 Index (QQQ). (See the chart below).
QQQ (Nasdaq 100 Index) Weekly Price and Trend Channels (Top), and MACD 19-26-9 (Bottom)
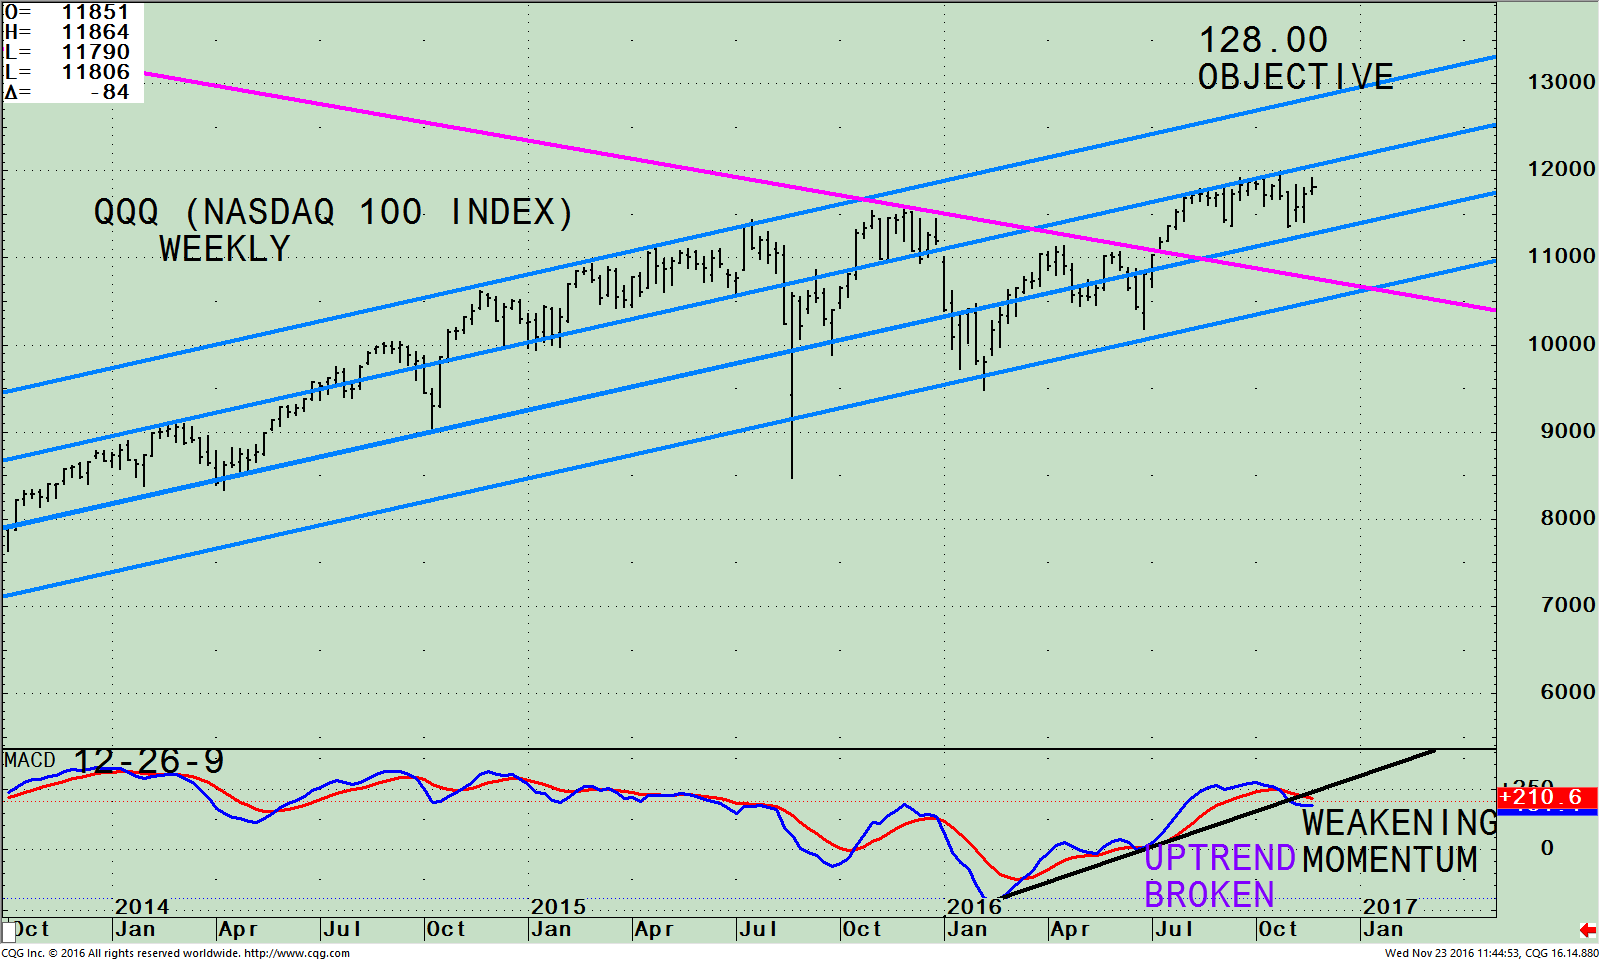
The top part of the chart shows the weekly Power Shares 100 (QQQ), Nasdaq 100, an exchange traded fund (ETF) representing the Nasdaq 100 Index, along with price and trend channels that are acting as support and resistance areas. QQQ includes 100 of the largest domestic and international nonfinancial companies listed on the Nasdaq stock market based on market capitalization. As of 11/22/16, Apple, (AAPL) is the largest holding comprising 10.65%, Microsoft Corp (MSFT) 8.42%, Amazon.com, Inc. (AMZN) 6.58%, Facebook, Inc. Class A (FB) 4.99%. Alphabet Inc. Class C (GOOG) 4.66% and Alphabet Inc. Class A (GOOGL) 4.09% totaling 39.39%.
All the top holdings peaked in October as investors started to shift away from the larger stocks to small and midcaps. Only MSFT is near its short term high. The other top stocks FB, GOOGL, GOOG, and AMZN have bounced off of their recent lows, however the intermediate and longer term charts have weakening momentum patterns that need to be monitored closely. Time will tell if these stocks will attract investors and push the Nasdaq 100 (QQQ) higher, or if further selling will occur. On a side note, the S&P 500 Index now leads the Nasdaq Composite in relative strength, which is near-term negative. Caution is warranted.
The QQQ has traded within the channel (blue lines) since July 2013, except for a one day blip that occurred in August 2015, where the QQQ tested the lows falling below the channel line. The QQQ is at 118.00, trading slightly under resistance at 120.00. A break above 120.00 for two days on a closing basis would be considered positive. The objective is 128.00, (top blue channel line). A break below 112.00 would not be a good sign. A break below the retracement line of the break out (pink line), would increase the likelihood of a more serious market decline.
The bottom half of the chart is MACD (12, 26, 9) a measure of momentum. MACD is on a sell. The pattern is not favorable at this time, showing weakening momentum as the intermediate uptrend line has been broken. Caution is necessary, if you are overweight in the top holdings of QQQ, I am recommending lightening up.
Just to Sum Up:
Investors are in the holiday spirit as all the major averages are at their highs. Sector selection is very important. Money is shifting out of bonds and into equities as interest rates are rising. Investors are in the process of repositioning their assets earlier than normal. Caution is warranted in the Nasdaq 100 (QQQ). I recommend reducing your exposure if you are overweight, because the top holdings representing almost 40% are losing momentum on an intermediate and long term basis and no longer is leading in relative strength.
I would love to hear from you. Please call me at 516-829-6444 or email at bgortler@signalert.com to share your thoughts or ask me any questions you might have.
If you like this article, then you will love this!
Click here for a free report: Top 10 investing Tips to More Wealth
*******Article in Systems and Forecasts November 23, 2016

Discover the right wealth building attitude…
Download a Free chapter of my book Journey To Wealth
Disclaimer: Although the information is made with a sincere effort for accuracy, it is not guaranteed that the information provided is a statement of fact. Nor can we guarantee the results of following any of the recommendations made herein. Readers are encouraged to meet with their own advisors to consider the suitability of investments for their own particular situations and for determination of their own risk levels. Past performance does not guarantee any future results.


Create more wealth in your life
with these simple strategies.
As an added bonus you will also
receive BG’s Updates and Ezine

Discover how to quickly create more well-being in your life with these simple strategies.
As an added bonus you will also
receive BG’s Updates and Ezine

As an added bonus you will receive BG’s Updates and Ezine

All work listed on BonnieGortler.com is licensed under a Creative Commons Attribution - Noncommercial - No Derivative Works 3.0 Unported License.
