

5 Investing Strategies to Save Money and Grow Wealth
04/11/2024
“You can be young without money, but you can’t be old without it.” ― Tennessee Williams
In the last newsletter I said I wanted to monitor the advance that would follow the decline to see which sectors would be leaders after the market stopped falling. I stated “it would be bullish if the aggressive groups such as Nasdaq 100 (QQQ), Russell 2000 (IWM) and Emerging Markets (EEM) lead the way higher. If the defensive sectors such as Utilities (XLU) Consumer Staples (XLP) and Health Care (XLV) are stronger, it would be negative, a sign that the rally will fail and the recent decline will resume”.
So what happened?
The stock market advance paused for a few weeks at the start of 2013, beginning a decline which made the market short-term oversold on a daily basis. Then, selling pressure dissipated and a reflex ex rally occurred as expected. However I didn’t expect the market to go straight up so quickly. Some areas like technology and health care penetrated resistance by challenging the old highs or by making a new high.
What we are witnessing today is a very resilient market that continues to climb the wall of worry with only small market corrections within a major uptrend.
There has not been a 10% correction in the S&P 500 since 2011. (We saw a 9% correction in 2012 and 6% in 2014 which occurred on the most recent decline which ended on February 5th.) Market volatility measured by VIX (a fear index) had big swings, closing at a peak reading of 21.44 on February 3 (its highest level since December 2012) and then fell to 14.26, a 33.5% drop in 16 days. As of this writing we are at 14.79 with the S&P 500 not quite at a new high. I am expecting more volatility going forward as we move from a favorable seasonal period for the stock market, to a more unfavorable period that starts in May. Tops take a long time to form, and warnings are frequently given before prices finally fall sharply.
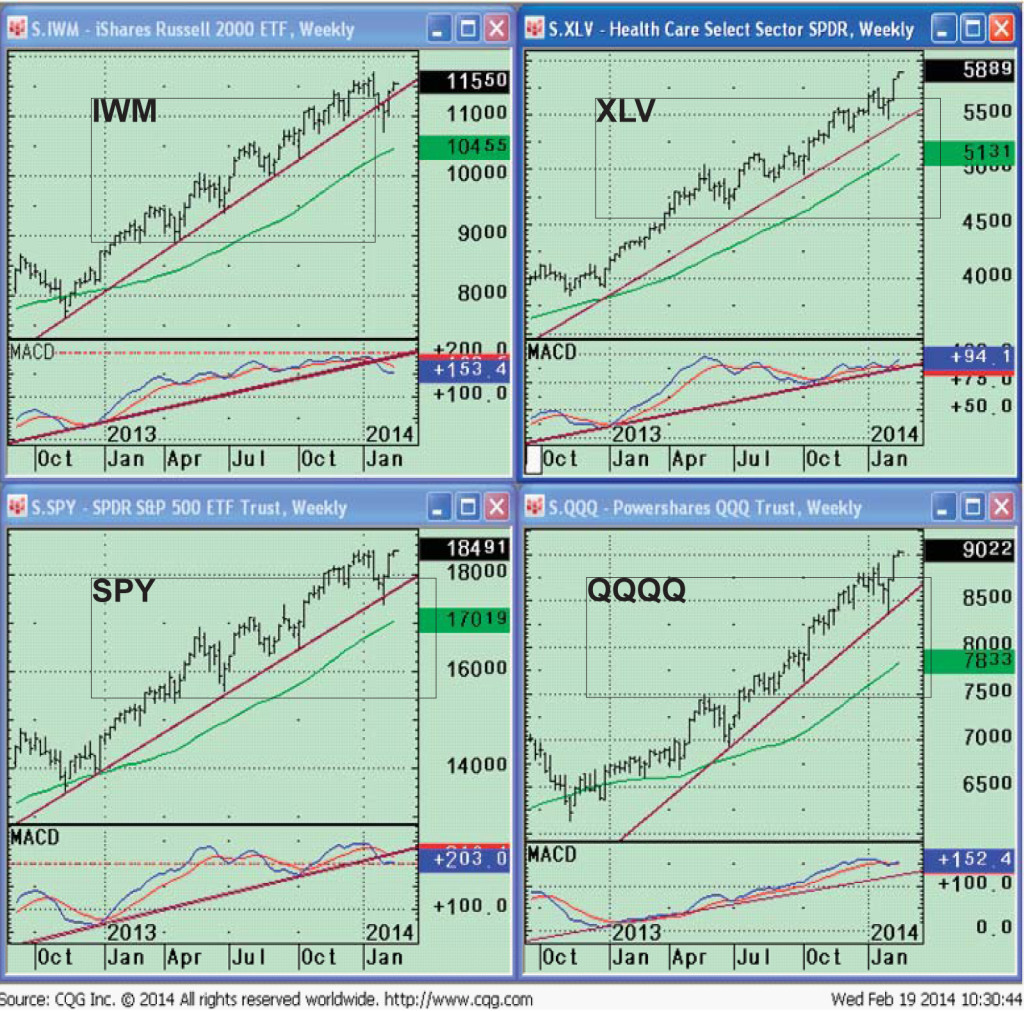
Top Left Chart—IWM WEEKLY
The Russell 2000 Index measures the performance of approximately 2000 small-cap U.S. companies. This sector has not generated substantial thrust in recent weeks, which is a warning. This is also confirmed by a clear MACD sell and a break in the uptrendline from October 2012. A break below 107.27 would suggest a decline to 104.00, near the 50 week average which stands at 104.53. This is a good support area and aggressive buy area for very aggressive traders.
Bottom Left Chart— SPY WEEKLY:
The S&P 500 Index based on the market capitalization of 500 large U.S. companies. The S&P 500 made a slight penetration of the uptrend from October 2012 and then stabilized. SPY is challenging its prior highs but has not exceeded them. As long as price trades above 170 the major uptrend will be favorable. I am worried that MACD has generated a sell which is a warning that the advance could be complete.
Bottom Right Chart—QQQ WEEKLY: The PowerShares QQQ is an exchange-traded fund based on the Nasdaq-100 Index. The Index includes 100 of the largest domestic and international nonfinancial companies listed on the Nasdaq Stock Market, weighted based on market capitalization. The weekly price uptrend was not violated on the latest pullback and the MACD uptrend remains in effect which is bullish. A break below 83.74 would suggest a decline to 80.00 near its 50 week moving average which now stands at 77.90 and rising. Apple and Google have led the Nasdaq to new highs. If they were to suddenly weaken this would be a warning that downside pressure in the sector could take place.
Top Right Chart—XLV WEEKLY: The Healthcare Sector SPDR (XLV) is made up health care stocks, mainly large pharmaceuticals and biotech companies. Healthcare is the strongest sector this month. Its price is in a strong uptrend, confirmed by MACD. This is considered a defensive area of the market which has usually outperformed during negative market climates. The fact that healthcare has been leading the market higher along with utilities on this latest rally is not a good sign for the overall market but it has been a good place to be invested.
In Sum
The leadership of the reflex rally continues to be split. The Nasdaq 100 Index, an aggressive sector, is leading the market higher with Apple and Google the stars (but now Apple is lagging). Health care (XLV), a defensive sector, also continues to be strong, which is a mixed message. The Russell 2000 ETF (IWM) has advanced but has not shown much leadership. Some of the price trends have been broken to the downside on the last decline, and MACD is rolling over, losing momentum which is a warning of a potential change of trend in all of the above chartsexcept XLV.
When the daily, weekly, and monthly MACD are all favorable, and aggressive sectors lead the advance money is made easier. Market tops take a long time to form. It is harder to make money when the intermediate trend turns down. Warning signals are flashing, financials are weakening, the transportation average did not make a high on the reflex rally and its pattern looks toppy like other charts. As long as the market keeps going up, investors will be happy, but it’s time to exercise caution if prices turn down from here. There will be a time when some news is disappointing, buying will turn into selling and a decline of more than 10% will take place. Be aware if market breadth starts to weaken again, fewer stocks make new highs and support levels are broken. These are signs to watch for that a significant decline could occur as we move towards May when our models could turn negative. Be ready for a potentially significant decline. Caution is advised. Review your portfolio, and have an exit strategy in place. I invite you to contact me with any comments or insights.
I invite you to contact me with any comments or insights, and to share your own favorite charts and indicators with me. Email: bgortler@signalert.com; phone: 1-800-829-6229.
FULL YEAR OF SYSTEMS & FORECASTS NEWSLETTER
at a SPECIAL DISCOUNT – $99
This is a hypothetical result and is not meant to represent the actual performance of any particular investment. Future results cannot be guaranteed.
Although the information is made with a sincere effort for accuracy, it is not guaranteed either in any form that the above information is a statement of fact, of opinion, or the result of following any of the recommendations made herein. Readers are encouraged to meet with their own advisors to consider the suitability of investments discussed above for their own particular situations and for determination of their own risk levels.


Create more wealth in your life
with these simple strategies.
As an added bonus you will also
receive BG’s Updates and Ezine

Discover how to quickly create more well-being in your life with these simple strategies.
As an added bonus you will also
receive BG’s Updates and Ezine

As an added bonus you will receive BG’s Updates and Ezine

All work listed on BonnieGortler.com is licensed under a Creative Commons Attribution - Noncommercial - No Derivative Works 3.0 Unported License.
