

5 Investing Strategies to Save Money and Grow Wealth
04/11/2024
“Risk comes from not knowing what you’re doing.” — Warren Buffett
After starting the year in the red, the stock market powered ahead with a broad-based rally, achieving the best February since 1998. The Nasdaq rose to its highest level since 2000. The S&P 500 (SPY) and Russell 2000 (IWM) made new all-time highs but momentum indicators failed to confirm the price highs, forming bearish divergences which normally take place at a market top. The market continues to climb the wall of worry, ignoring bad news and keeping the long-term trend since 2009 intact.
What are the charts saying now?
Nasdaq 100 QQQ Weekly Price Uptrend is Alive and Well, but Momentum is Weakening
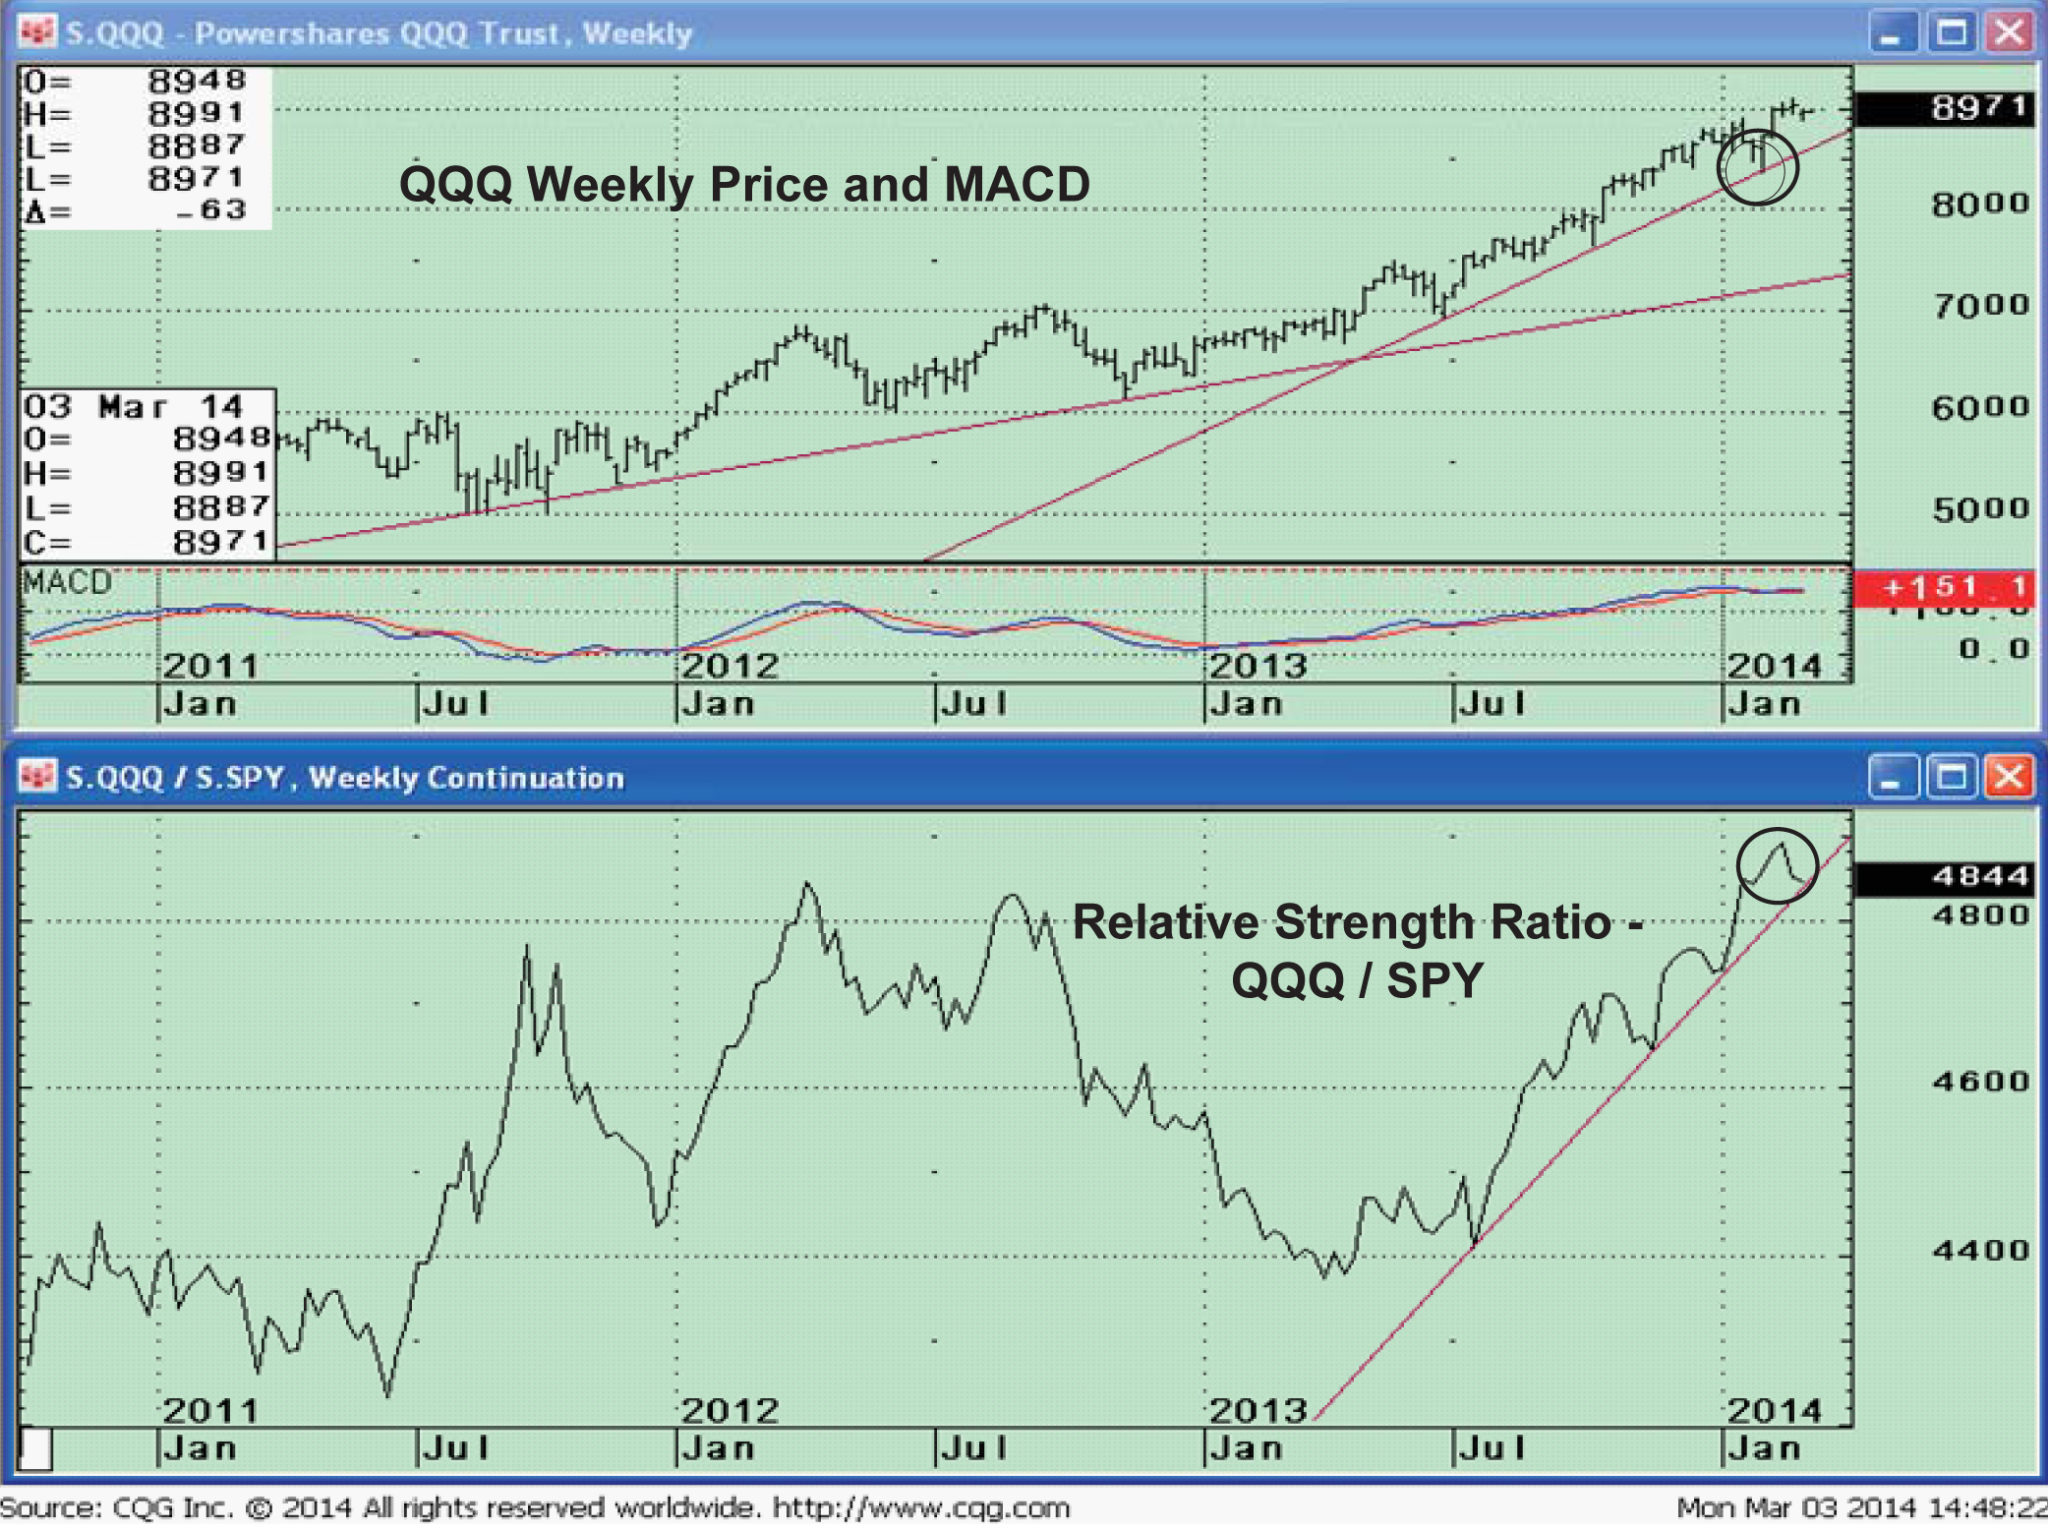 In the top portion of the above chart, you can see that the Nasdaq 100 price (QQQ) after a pullback in January, held the rising trendline from June 2013. Buyers supported the market, with the price once again turning higher and making a new high. Notice how the technical indicator MACD has not confi rmed the high in price, and has begun to roll over on its recent high, its fi rst divergence in over 2 years. It is a little worrisome to see the pulse of momentum getting less, not stronger.
The lower chart above shows that the QQQ has lost some of its strength relative to the S&P 500 (SPY) as price marches to new highs, with Apple a large portion of the index not participating in the latest rally. The weekly Relative Strength ratio rose to an almost 2-year high on February 18th, which is bullish. As of this writing a new high has not been made, but the weekly uptrend remains intact. A change in trend would be a warning signal, if the QQQ continued to lose strength relative to the S&P 500 (SPY) and the trendline were broken to the downside.
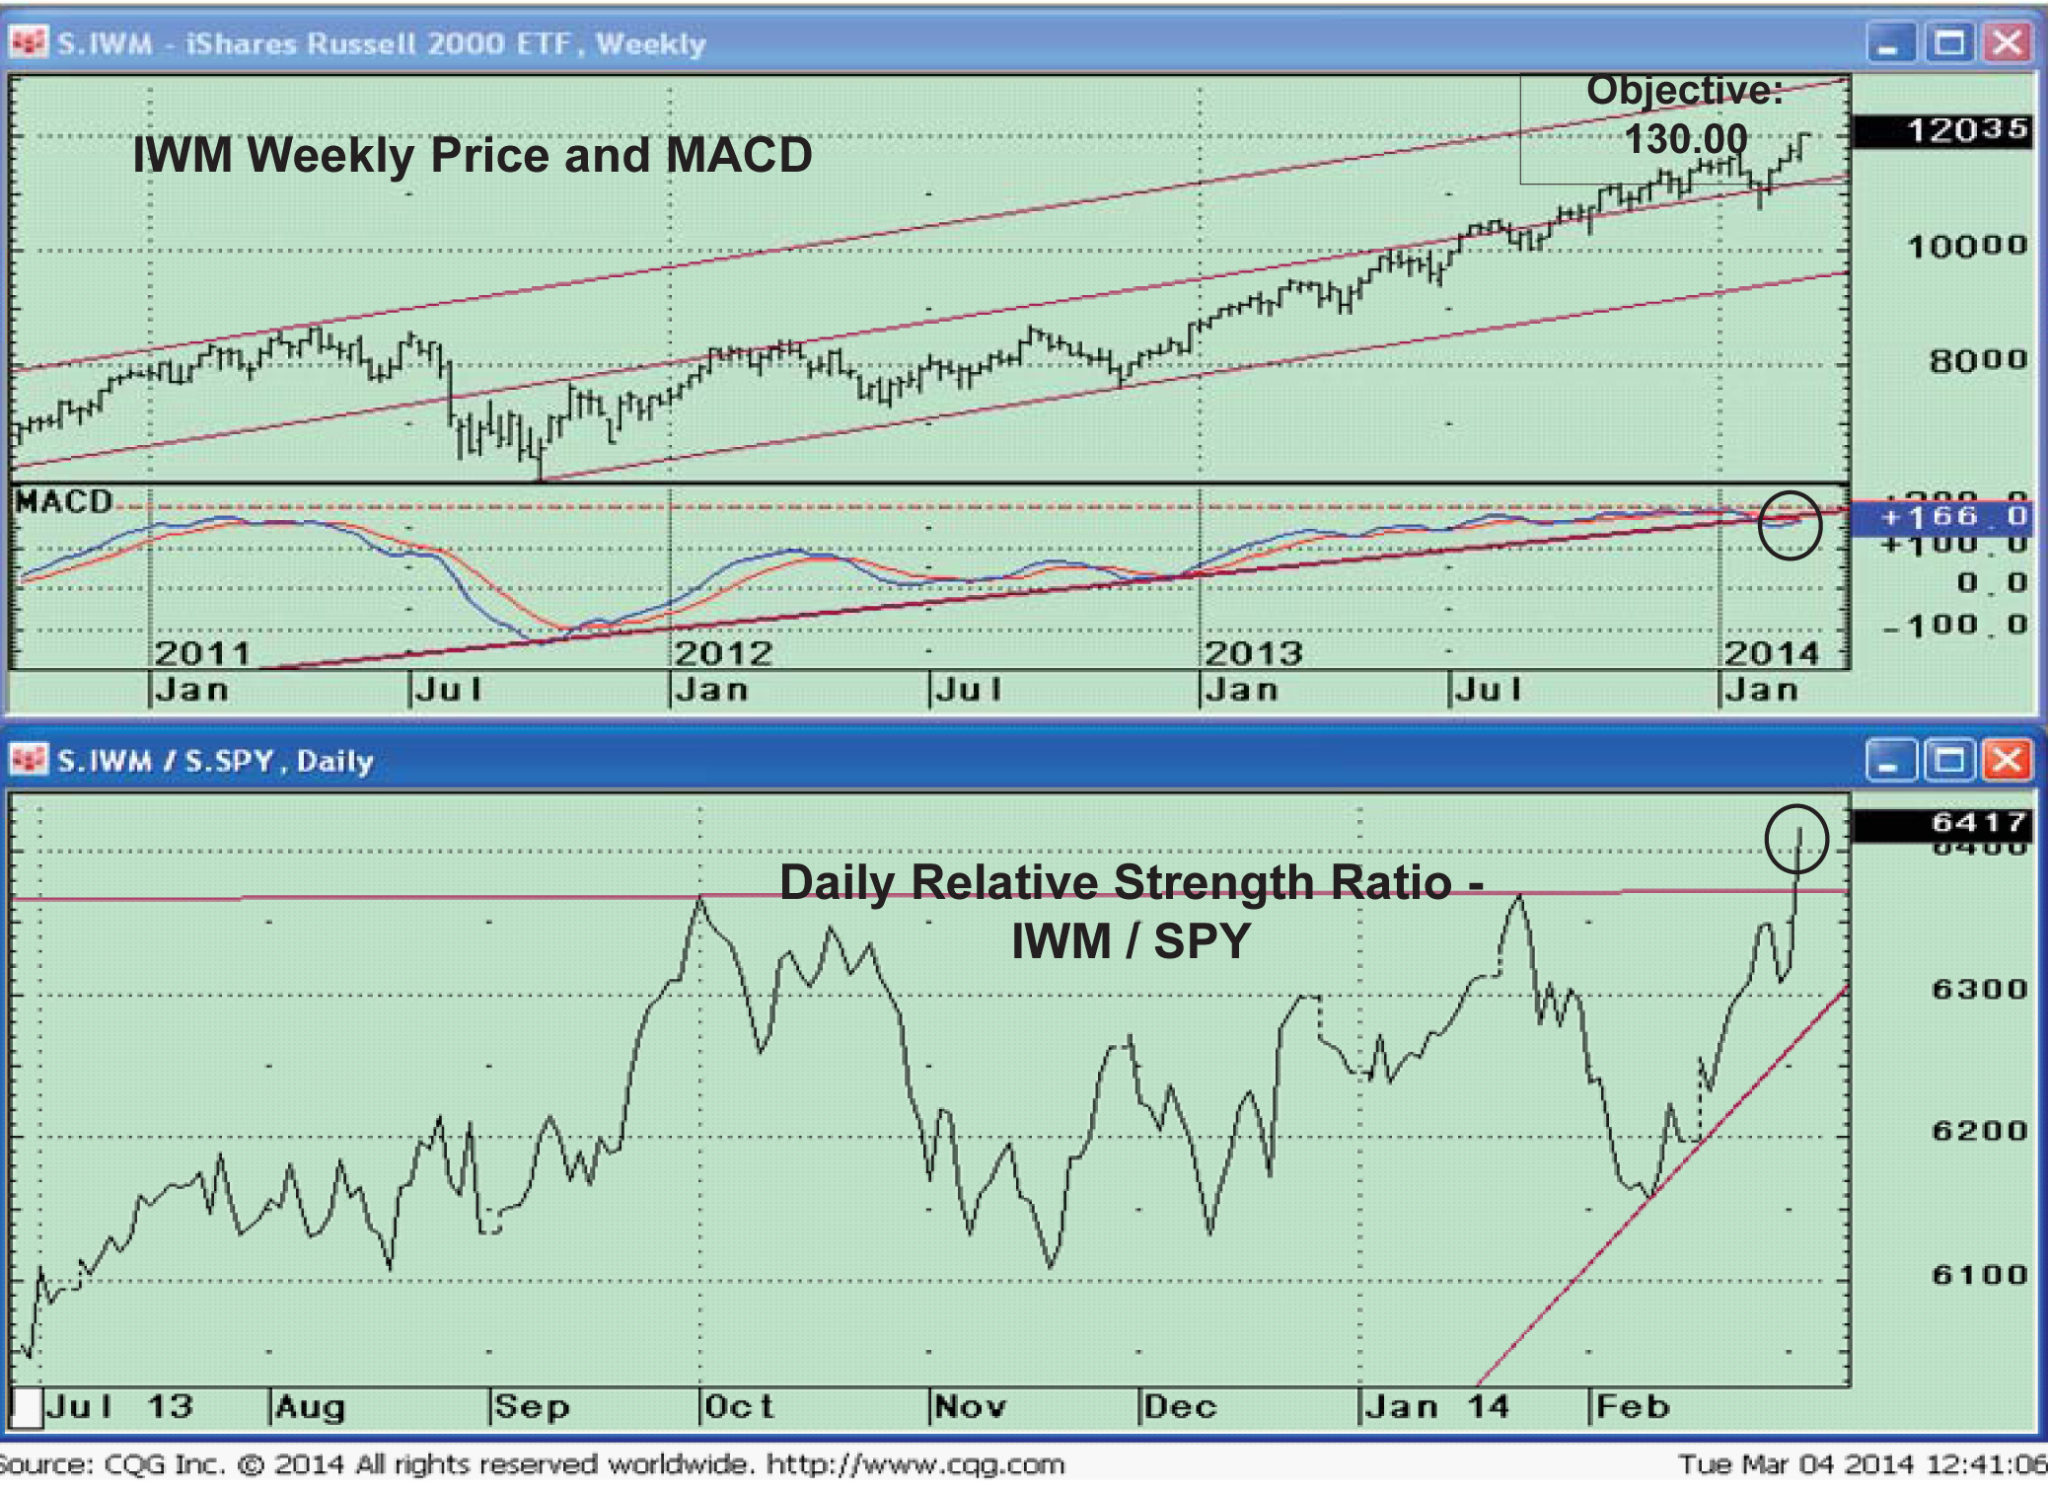
New Strength in the Russell 2000 (IWM) Leading the Market Advance
The Russell 2000 Index measures the performance of approximately 2000 small-cap U.S. companies. Small Caps were lagging the S&P 500 in recent weeks, which I didn’t view as a bullish sign. We did have a pullback but no heavy selling pressure materialized, even with MACD on a clear sell along with a trend line break to the downside which you can see in the upper portion of the chart below .
 A New Development Has Taken Place
A bullish case for a continued move higher can be made. The Russell 2000 (IWM) has regained leadership, as shown on the daily chart above. The relative strength ratio IWM/SPY (bottom half of chart) has made a new high, the highest level since September 2013. This is a very encouraging sign and suggests this rally could have another leg up from here. The weekly ratio (not shown) also has made a new high confirming this breakout. There is also a good chance on Monday March 10, 2014 our trading model which measures weekly market breadth will generate a buy signal.
 More Positives
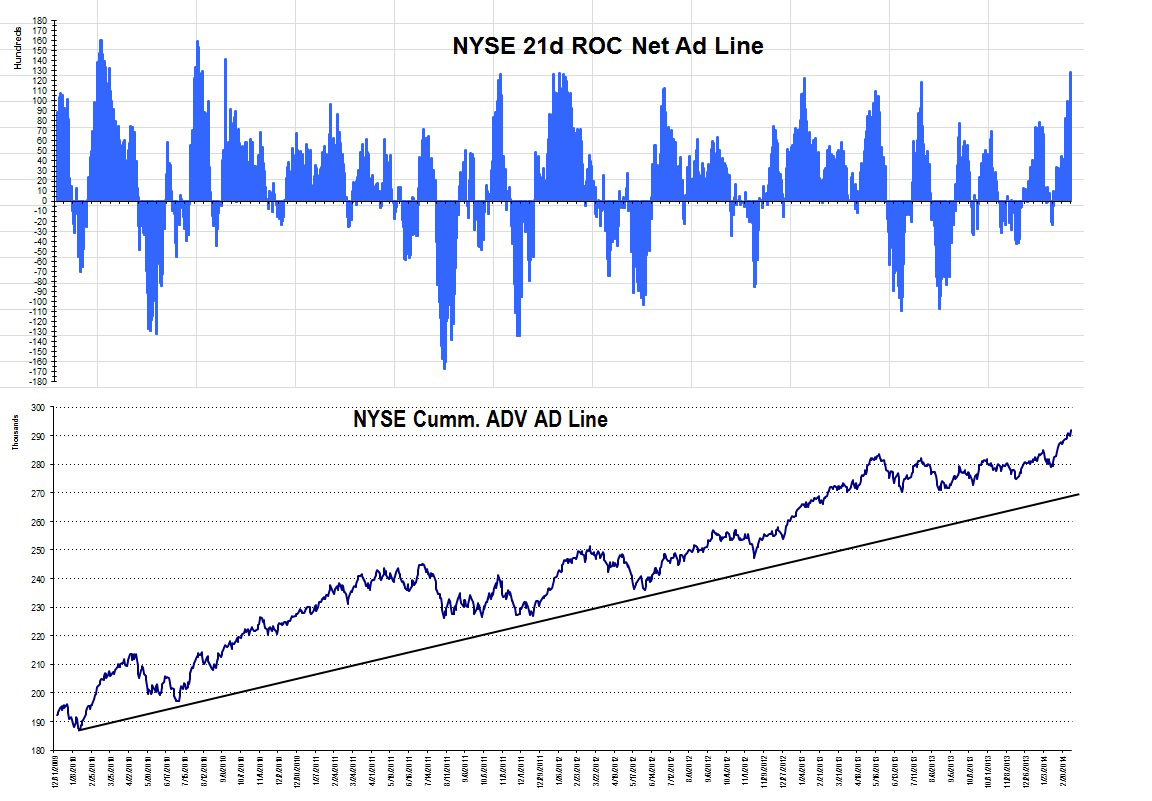
• The Cumulative Daily NYSE Advance Decline Line continues to make new highs, confirmed by the 21 day Rate of Change of the Net Advance/Decline Line (see chart above)
• New Lows on the New York Stock Exchange remain very low.
• The Dow Jones Transportation Average confirmed the Dow Jones Industrial Average high in January 2014. Both have recently made new highs.
• Financials, which have been lagging, are coming to life, gaining relative strength vs. the S&P 500.
• The iShares MSCI Emerging Markets Index ETF (EEM), although not leading the market, has stabilized and has improving chart patterns.
• The S&P 500 and Russell 2000 both set all-time closing highs.
Just to Sum Up
The market’s reversed the losses of January with a strong February. During the fi rst two months of this year the leadership was in defensive areas, healthcare, utilities and income-oriented investments, which would normally be a cautionary sign. With this most recent rally the market advance continues despite the negative divergences in some charts. However, it is bullish that money is starting to move into riskier assets. The resurgence in the small cap sector suggests the market will continue higher with the IWM channel objective of 130,00, almost 9% higher than where we are now. I am optimistic this rally will continue with the small caps leading the way. It would take a break below 107 for IWM would negate my bullish outlook.
Please contact me with any comments or insights, and to share your own favorite charts and indicators with me. Email: bgortler@signalert.com; phone: 1-800-829-6229.
FULL YEAR OF SYSTEMS & FORECASTS NEWSLETTER
at a SPECIAL DISCOUNT – $99
This is a hypothetical result and is not meant to represent the actual performance of any particular investment. Future results cannot be guaranteed.
Although the information is made with a sincere effort for accuracy, it is not guaranteed either in any form that the above information is a statement of fact, of opinion, or the result of following any of the recommendations made herein. Readers are encouraged to meet with their own advisors to consider the suitability of investments discussed above for their own particular situations and for determination of their own risk levels.


Create more wealth in your life
with these simple strategies.
As an added bonus you will also
receive BG’s Updates and Ezine

Discover how to quickly create more well-being in your life with these simple strategies.
As an added bonus you will also
receive BG’s Updates and Ezine

As an added bonus you will receive BG’s Updates and Ezine

All work listed on BonnieGortler.com is licensed under a Creative Commons Attribution - Noncommercial - No Derivative Works 3.0 Unported License.
