

5 Investing Strategies to Save Money and Grow Wealth
04/11/2024
“The art is not in making money, but in keeping it.”–Proverb
The internal momentum of the stock market continues to get weaker even though the S&P 500 (SPY) is trading near its highs. However, the S&P 500 (SPY) is one of the stronger major indices, holding up much better than more aggressive sectors of the market such as Biotechnology and Technology which have sold off sharply the past few weeks.There are warning signals on weekly and intermediate charts. We are moving into an unfavorable time of the year, suggesting now is a good time to review your investments to be prepared if the market no longer continues to rise and a decline of greater magnitude occurs. I don’t feel we are out of the woods despite the rally so far this week, and I believe more selling pressure lies ahead even though the S&P 500 is above support levels
What is the Weekly S&P 500 SPDR (SPY) Chart Saying Now?
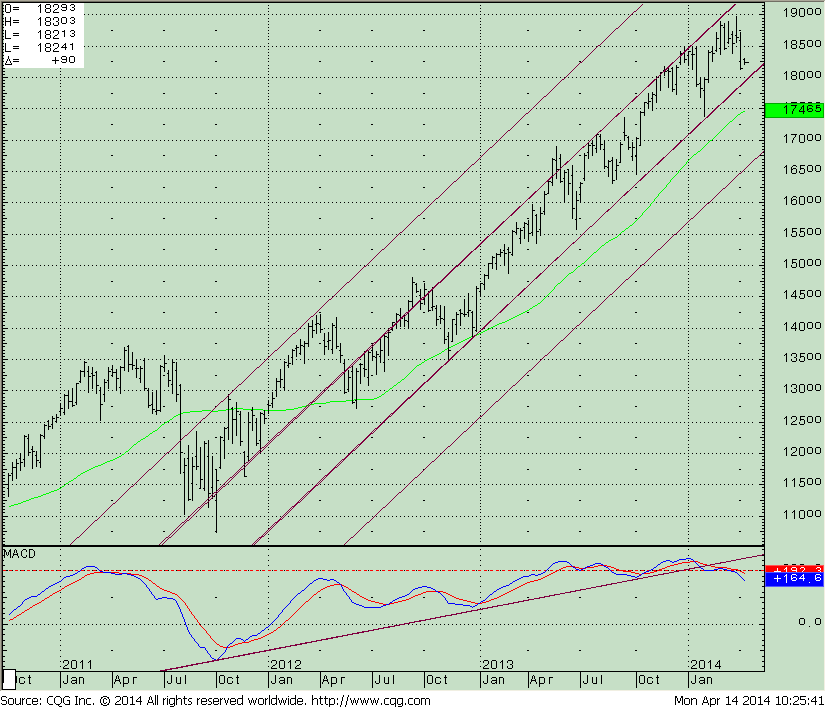
The top portion of the chart shows the S&P 500 weekly price trend remains favorable. The uptrend in price from October remains intact. There seemed to be increased selling pressure on the recent decline, with the (SPY) breaking below 184, an old support level that held the past few weeks. The key support now is 180.00. If violated, more selling could take place with a downside channel objective suggesting a further decline to 167.50.
The lower portion of the chart remains problematic to me. MACD has already fl ashed a warning signal with the uptrend clearly violated The uptrend was broken in early January but only a small amount of profit taking has taken place. Now another negative divergence is in place. Price has made a higher high but MACD has not confirmed the latest highs. The difference now is that prior leaders such as biotechnology and technology are now out of favor. They have been hit hard, falling more sharply than others. I have been watching, and have noticed each time a short term rally begins, there is no follow through to the upside. Sellers step in and take control quickly moving prices lower. Relative strength is getting weaker not stronger. Traders seem to be rotating into defensive areas of the market for safety such as utilities and consumer staples which are acting better.
What is the Monthly S&P 500 SPDR (SPY) Chart Saying Now?
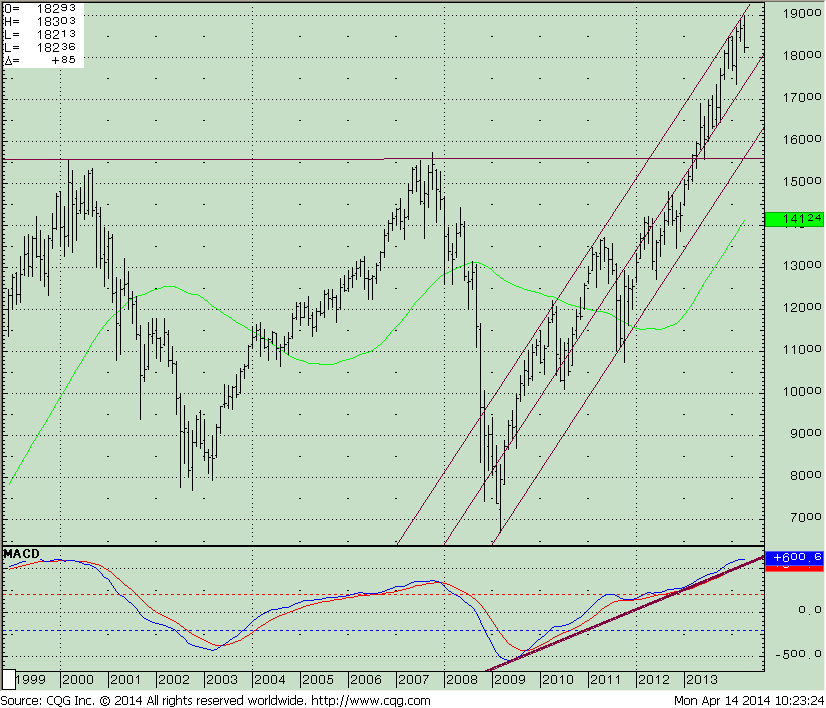
The long term message is clear: still positive. The market broke through resistance in April 2013 and has not looked back since, with each month price making higher lows. A break below 173 on a monthly basis will change the price trend from favorable to unfavorable. If penetrated we can do a full test of the breakout and retrace to 155.00 on the SPY. The lower portion of the above chart is the MACD oscillator which bottomed in 2009 shows the uptrend remains in effect. Notice how the oscillator is no longer rising, but has confirmed the highs in the SPY. As long as the uptrend remains in effect the bulls will remain in control. If we were to violate the uptrends I believe more selling will take place in the market and it will be harder to make money on the long side.
 What is the Weekly Russell 2000 (IWM) Chart Saying Now?
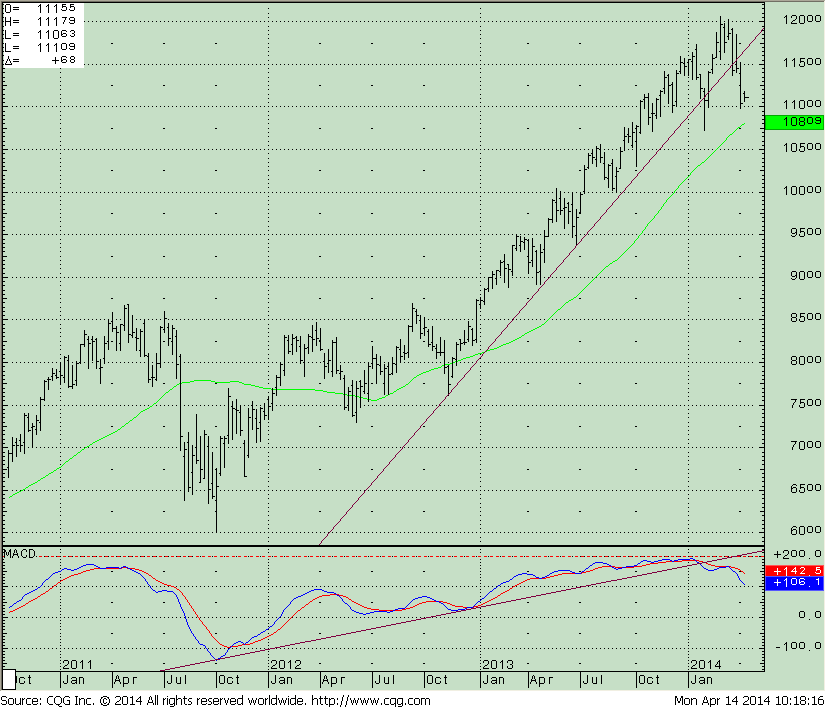
The top portion of the chart shows the Russell 2000 (IWM) weekly price trend now as favorable as the S&P 500. The uptrend has been violated twice from the October 2013 low. The first penetration was a false break to the downside with prices quickly reversing to the upside. This time small caps are not leading the market higher, and losing relative strength to the S&P 500, not a good sign for large gains ahead. The uptrend is no longer in effect. Resistance above is 117. 50 and support is 107.50. MACD on the lower portion of the chart is unfavorable clearly showing a weakening of momentum.
What is the Monthly Russell 2000 (IWM) Chart Saying Now?
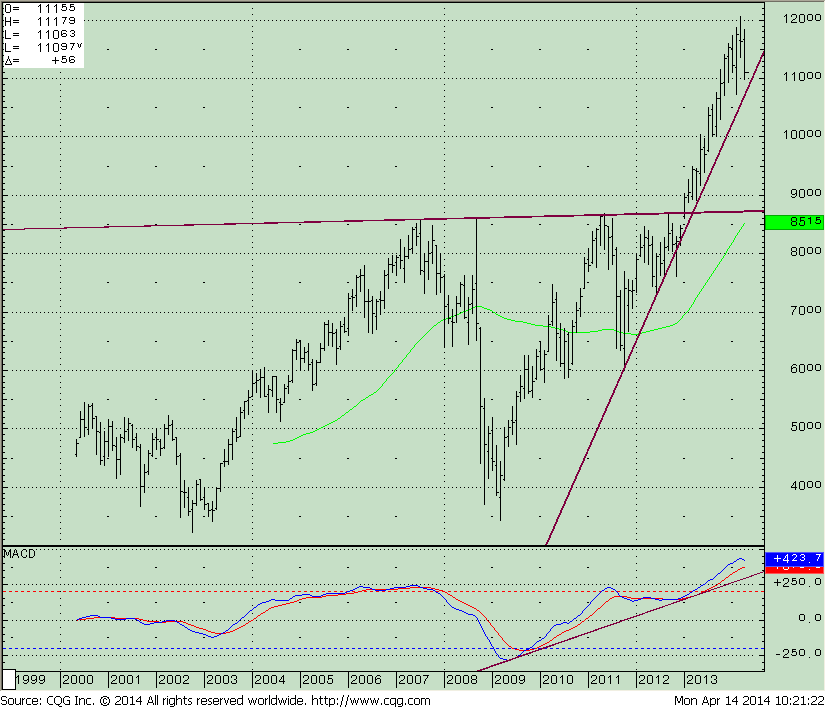
The long-term message is clearer than the intermediate time frame (weekly chart), still positive but weakening. The Russell 2000 (IWM) broke through resistance in January 2013 before the S&P 500. In February 2014 prices fell but rallied to a new high. This month we have been unable to take out the high, now trading at 111.86 as of this writing. A break below 107 would be unfavorable. If penetrated, new downside projections of 97.50, followed by 87.50, a retracement to levels not seen since 2012. Momentum as measured by MACD is favorable with the uptrend in effect but is weakening and needs to be monitored for further turn down and a break in trend.
….
Any comments or insights? Please Email me: bonnie@bonniegortler.com; phone: 1-800-829-6229.
GET A FULL YEAR OF THE SYSTEMS & FORECASTS NEWSLETTER
for a SPECIAL DISCOUNT – $99
This is a hypothetical result and is not meant to represent the actual performance of any particular investment. Future results cannot be guaranteed.
Although the information is made with a sincere effort for accuracy, it is not guaranteed either in any form that the above information is a statement of fact, of opinion, or the result of following any of the recommendations made herein. Readers are encouraged to meet with their own advisors to consider the suitability of investments discussed above for their own particular situations and for determination of their own risk levels.


Create more wealth in your life
with these simple strategies.
As an added bonus you will also
receive BG’s Updates and Ezine

Discover how to quickly create more well-being in your life with these simple strategies.
As an added bonus you will also
receive BG’s Updates and Ezine

As an added bonus you will receive BG’s Updates and Ezine

All work listed on BonnieGortler.com is licensed under a Creative Commons Attribution - Noncommercial - No Derivative Works 3.0 Unported License.
