

Bonnie’s Market Update 4/12/24
04/14/2024
“In the long run, it’s not just how much money you make that will determine your future prosperity. It’s how much of that money you put to work by saving it and investing it.”–Peter Lynch
Forecasting the market is always a challenge but when the market is split (some sectors rise and others fall) the challenge is even greater because it doesn’t happen often. In the past few months divergences have persisted on some charts, which has been worrisome. However, the S&P 500 was strong and resilient, working its way higher without many pullbacks. In the back of my mind I knew that risk was likely to be contained, with our models positive and favorable seasonality in effect. At times I thought the S&P was going to break out to new highs, but the next day the market reversed and a short term decline of a few percent would follow. Some of the more aggressive areas such as technology (QQQ), biotech, (XBI) small cap (IWM) and the internet sector (FDN) were more volatile, peaked in March, and started to lose relative strength to the S&P 500 (SPY). So where are we now?
What are the Charts Saying Now? The iShares MSCI Emerging Markets Index ETF (EEM) has been a profi table investment since the bottom made in early February 2014. The ETF (EEM) very quickly made and hit the objective of 42.50 that I mentioned in the March 21, 2014 newsletter. As of May 12, 2014 its top holdings were in China 17.02%, South Korea 15.79%, Taiwan 11.69%, and Brazil 11.54%. Notice the top portion of the EEM weekly price chart below, where another bullish development has now taken place. EEM has clearly penetrated the downtrend from April 2011 based on price and confirmed by momentum, using the MACD indicator in the lower portion of the price chart. The bottom portion of this chart shows the Relative Strength weekly ratio of the Emerging Market/S&P 500 (EEM /SPY). Rising means the Emerging Market (EEM) is stronger and falling means EEM is weaker. The downtrend that began from the December 24, 2012 was broken March 24, 2014, and has so far successfully tested the breakout. If further strength continues this could help support the US market so that any decline if it does occur would most likely be contained. The lower portion with MACD has also confirmed this breakout and has made a new high. Internet stocks have been a very profitable area for aggressive traders since November 2012.
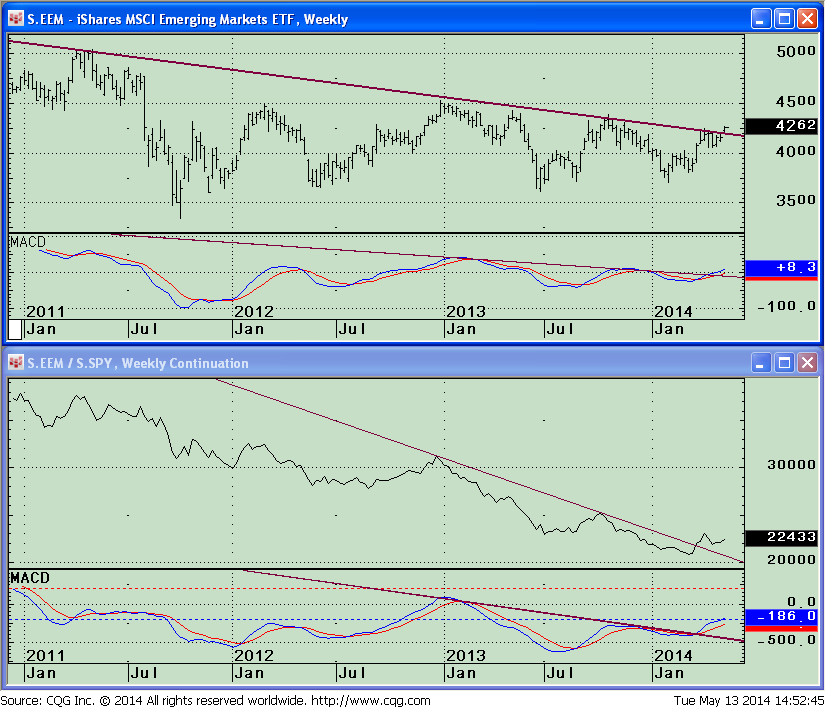
Figure: iShares MSCI Emerging Market Index, weekly. Top half: price and MACD have both broken down trend lines. Bottom half: Relative strength (EEM / SPY) and the MACD of this ratio have also both broken established downtrends.
Social media stocks such as Twitter and Facebook have had their ups and downs since they started trading. The Internet sector is an aggressive high risk area which appears to have stabilized.
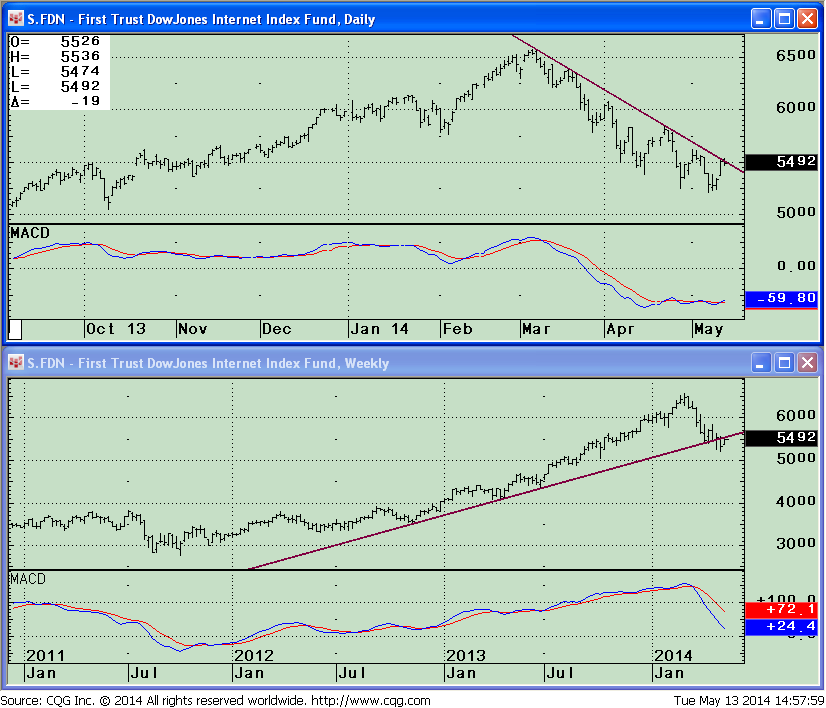
I would like to bring to your attention to The First Trust DJ Internet Index Fund ETF (FDN), as it could guide us on the direction of the market looking ahead. An ETF such as FDN provides diversifi cation, with less risk than owning one single stock. As of May 12, 2014 the top holdings of the FDN consist of Information Technology 70.92%, and Consumer Discretionary 22.64% along with small portions in Financials and Health care. The largest holdings are Amazon.com, Facebook Inc.,eBay, The Priceline Group Inc. and Google Inc. comprising 35.26% of the ETF (FDN) portfolio. You can see on the top portion of the daily chart of FDN (below, right) that in early March selling pressure began and a decline of almost 21% occurred. A downtrend is in effect but very close to be broken to the upside which would be a short term bullish development for the sector.MACD is also in favorable position suggesting a short term rally could be imminent. The weekly chart of FDN is not in as favorable position as the daily chart but does look promising. Price is trading just below the downtrend line from where price broke below and MACD is still falling. There is no flattening yet in the indicator, but would be a good sign if and when it takes place. A break above 56.00 would give an objective to 59.00. A break below the lows around 52.00 would be considered bearish and a continuation of further weakness in this area would be expected. Due to the downside trend break, I am not expecting this area to be the leader of the market but a stable internet will help the overall market.
Just To Sum Up: The S&P 500 continues to be resilient, a good investment, trading close to its highs. Favorable seasonality is gone as we move into the summer months and our models are not as positive as they were earlier this year. Nevertheless opportunity exists even with stock selection more of a challenge with traders moving in and out of sectors quickly despite more potential risk. The emerging market sector is gaining strength, which could be the next catalyst for further strength in the US market. More volatile sectors like biotech, and internet that were declining, appear to have stabilized. I will give market the benefi t of the doubt for now with favorable chart patterns suggesting a rally could be sooner rather than later. If the S&P 500 500 (SPY) falls below 180.00, the First Trust DJ Internet Index Fund (FDN) breaks below 50.00 and emerging market (EEM) falters I will have to change my bullish stance.
Share your thoughts where you think the aggressive market sectors are heading. Are you expecting higher or lower prices?
Please Email me at bgortler@signalert.com or call me at 1-800-829-6229 with any comments or insights.
This is a hypothetical result and is not meant to represent the actual performance of any particular investment. Future results cannot be guaranteed.
Although the information is made with a sincere effort for accuracy, it is not guaranteed either in any form that the above information is a statement of fact, of opinion, or the result of following any of the recommendations made herein. Readers are encouraged to meet with their own advisors to consider the suitability of investments discussed above for their own particular situations and for determination of their own risk levels.


Create more wealth in your life
with these simple strategies.
As an added bonus you will also
receive BG’s Updates and Ezine

Discover how to quickly create more well-being in your life with these simple strategies.
As an added bonus you will also
receive BG’s Updates and Ezine

As an added bonus you will receive BG’s Updates and Ezine

All work listed on BonnieGortler.com is licensed under a Creative Commons Attribution - Noncommercial - No Derivative Works 3.0 Unported License.
