


Bonnie’s Market Update 4/12/24
04/14/2024
“A loss never bothers me after I take it. I forget it overnight. But being wrong – not taking the loss – that is what does damage to the pocketbook and to the soul”. – Jesse Livermore
The S&P 500 index made a new high on July 3, 2014, however there has been no follow through to the rally. Prices stalled at the top of the monthly channel, not reaching the next milestone of 200 for the S&P 500 SPDR (SPY) which I mentioned in the 07/3/14 newsletter. After testing its prior highs, the iShares Russell 2000 Index ETF (IWM) was unable to sustain a meaningful advance and then turned lower after it hit resistance in the 120 area. The broader market is not acting well, weaker than the S&P 500 Index in terms of relative strength. New highs are contracting, and there is slowing momentum.
This year the S&P 500 has been a relatively quiet market index with intra-day gains and losses contained to less than 1% over the last two months. If support levels are broken, more volatility and wider trading swings could happen more frequently in the next few months. As for traders that buy on dips, you may find it more difficult to make a profit in the future when the market correction takes place. Even though the market is moving higher,and trading near its highs, more negative divergences are evident on the charts which are worrisome. As a result, I am more cautious.
The iShares Russell 2000 Index ETF (IWM) Daily Chart
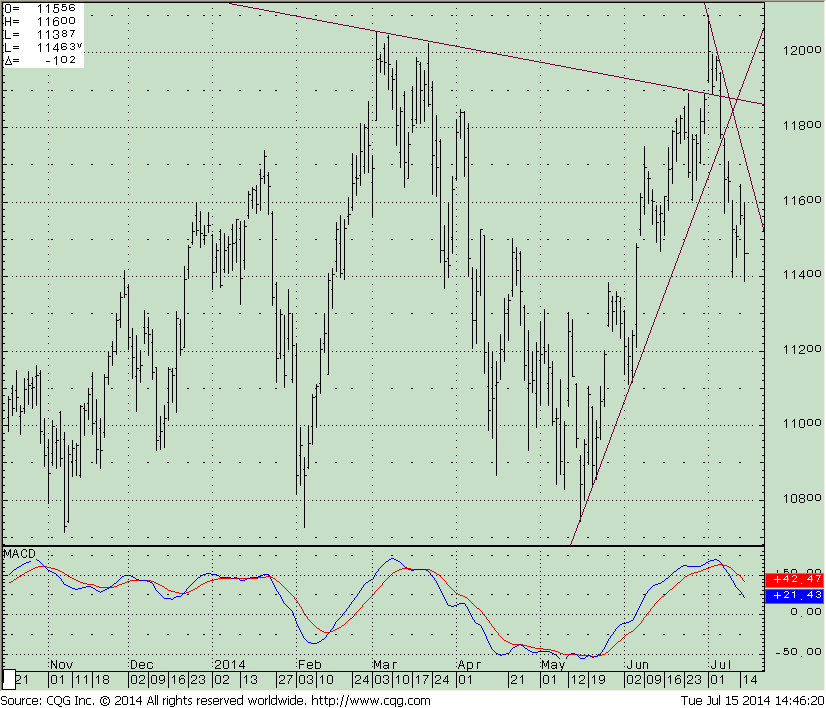
The top portion of the chart above shows that the iShares Russell 2000 Index ETF (IWM) made a new high at 120.97, a fake breakout to the upside. Buyers quickly turned to sellers and the uptrend was violated to the downside. IWM fell almost 6% in 9 trading sessions with an intra-day low so far of 112.99 on July 17, 2014.
The bottom portion shows the MACD oscillator generating a sell, accelerating down in an unfavorable position, with no buy pattern or basing formation present.
Sometimes when a breakout reverses, a sharp decline will take place. If small caps remain out of favor and traders don’t want to be in the more volatile high risk areas of the market this could be the time when support no longer holds and a more serious decline takes place. A break below 112.50 gives objectives to the 102-105 area.
The iShares Russell 2000 Index ETF (IWM) Weekly Chart
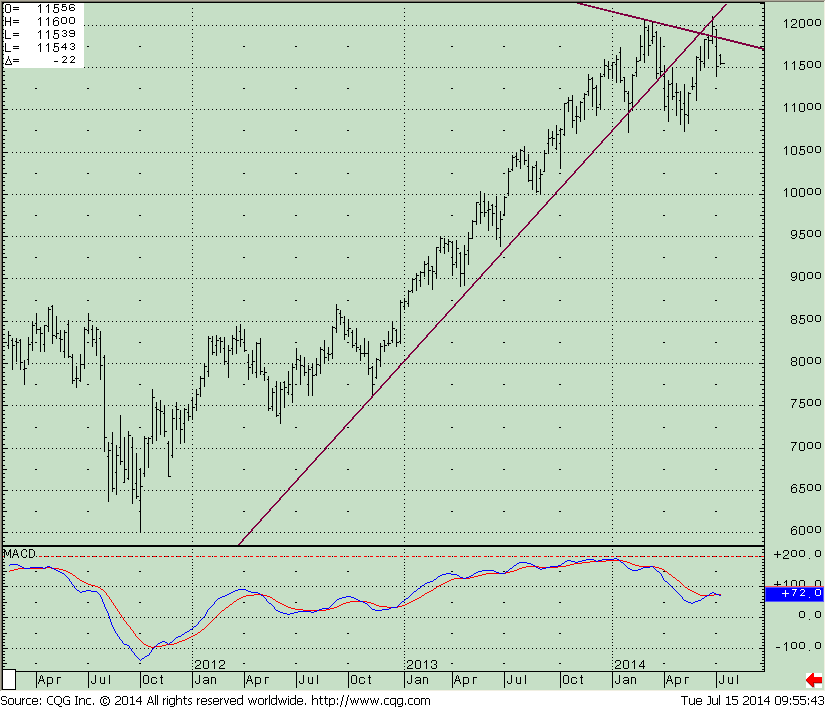
The weekly chart to the right shows that IWM (the top half) failed to get through the 120 area and didn’t penetrate the up-trend line that began in November 2012.
The lower half of the chart is somewhat disturbing. The high in the MACD oscillator in March 2014 didn’t confirm the price high–a negative divergence. The latest price high (June 30) is clearly unconfirmed with an even lower MACD reading, showing even less strength and diminishing momentum. Ultimately, this will get the best of the bulls and the bears will take control. I believe this will be sooner rather than later.
Just To Sum Up:
The stock market failed to follow through at the upper monthly channel of the S&P 500 instead of moving higher. The market is getting more selective where you want to be invested to manage your risk. Aggressive sectors now have chart patterns with weakening momentum that are not favorable, more risk, with expected wider swings in price from high to low. The iShares Russell 2000 Index ETF (IWM) is trading below the up-trend line on the daily chart from May 2014, and trading below the up-trend line that began in November 2012 on the weekly chart which is disturbing.
So far the market is unable to break through weekly resistance lines. It appears that it is possible the short term peak has been made and a larger decline could occur. I am now much more concerned with the weakening momentum that is more noticeable in many charts and I am more cautious. It is looking like the odds of a summer correction are increasing.
I strongly recommend that you review your portfolio and evaluate the risk vs. the potential reward on your investments. If the S&P 500 (SPY) falls below 192 and the small caps break below 112.50 a larger decline could take place. Over the next few weeks if the market opens down sharply and doesn’t rally to over the opening price by 11:00 EST the odds will favor price to continue to be under pressure and prices to continue lower.
Please feel free to call and share your insights with me at 1-844-829-6444 or Email me at bgortler@signalert.com with your comments.


Create more wealth in your life
with these simple strategies.
As an added bonus you will also
receive BG’s Updates and Ezine

Discover how to quickly create more well-being in your life with these simple strategies.
As an added bonus you will also
receive BG’s Updates and Ezine

As an added bonus you will receive BG’s Updates and Ezine

All work listed on BonnieGortler.com is licensed under a Creative Commons Attribution - Noncommercial - No Derivative Works 3.0 Unported License.
