

Bonnie’s Market Update 4/12/24
04/14/2024
“The investor of today does not profit from yesterday’s growth.”
~Warren Buffett
In the July 18th newsletter I wrote an article “The stock market is more vulnerable now more than any time this year”. Since then the stock market rose for a few days, failing to generate any kind of upside momentum. The market then turned lower but did not break below key support areas. Once again the buyers stepped in and the selling stopped. The pulse of each rally this year has been losing momentum for quite some time now and eventually a larger market correction will occur. The market appears to be in the process of taking a rest like I did. (I recently returned from a 3 week vacation in Aruba.) The market has recovered some, but so far it’s not convincing enough for me to believe this rally will continue for much longer. The position of many of the technical indicators doesn’t appear quite right. It’s still an unfavorable seasonal period for the stock market, caution is warranted and preservation of capital is good to have in the forefront of your mind.
Insights and Chart Observations Where We Are Now
The S&P 500 ETF (SPY) peaked on July 24th, while the weaker Russell 2000 ETF (IWM) peaked on July 1, 2014.
The S&P 500 ETF (SPY) hit the upper channel on the monthly chart in July, not able to make a new milestone.
Chart 1: SPDR S&P 500 ETF Trust (SPY) Daily
On the recent sell off the S&P 500 ETF (SPY) fell to 190.55 breaking the daily uptrend from February 2014, changing the short term trend from up to down. Price bounced up alleviating the oversold condition but I remain suspicious of the recent rally. As of this writing, price has been unable to reach and penetrate the 195-197 area, the old support area is now acting as resistance. (Chart 1). A break below 190.00 would suggest a decline likely to 184.00 (the short term channel objective). MACD, a momentum indicator is below 0 in oversold position but no favorable pattern has developed that suggest prices should rise.
Chart 1 (right): SPDR S&P 500 ETF Trust (SPY) Daily
The S&P 500 ETF (SPY) monthly chart (not shown) remains in an uptrend from 2009 in terms of price but MACD is pointing down and is very close to breaking its up-trendline. The trend in the S&P 500 ETF (SPY) monthly RSI is also very close to being broken to the downside. Depending on how you scale the chart there is a very slight penetration of the up-trend line in RSI from 2009. I will be watching this closely and will post the chart when broken.
The small cap index Russell 2000 ETF (IWM) has not been a profitable area to invest in this year. On several occasions this year I was hoping small caps would lead the market higher, but so far this is not the case. Small caps continue to lag the S&P 500, not a sign of a healthy market. Technical indicators such as MACD and RSI on the daily chart are oversold and in favorable position for a rally (chart not shown). There has been no sign of change of leadership to suggest that small caps will improve in relative strength and lead this market higher.
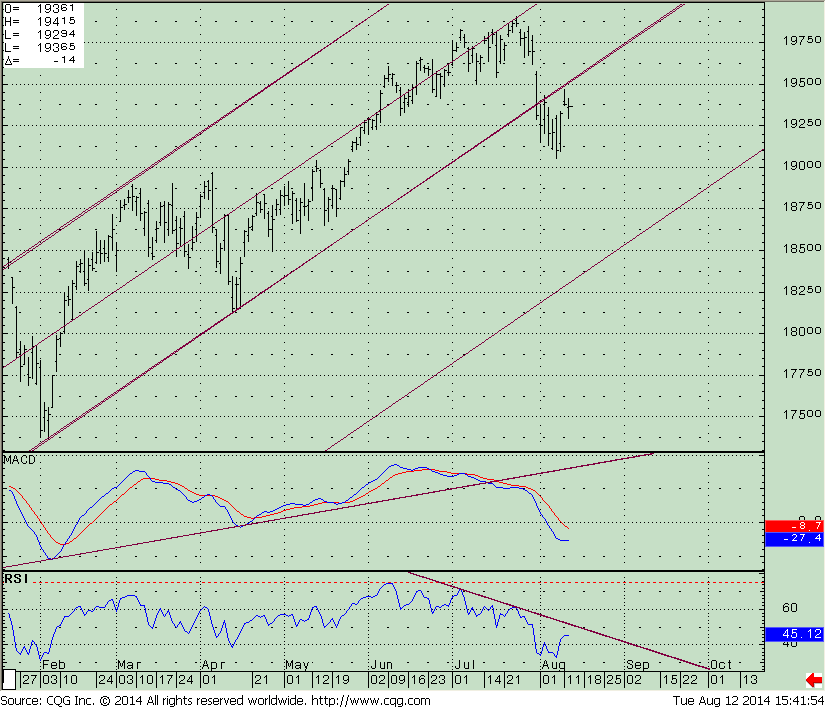
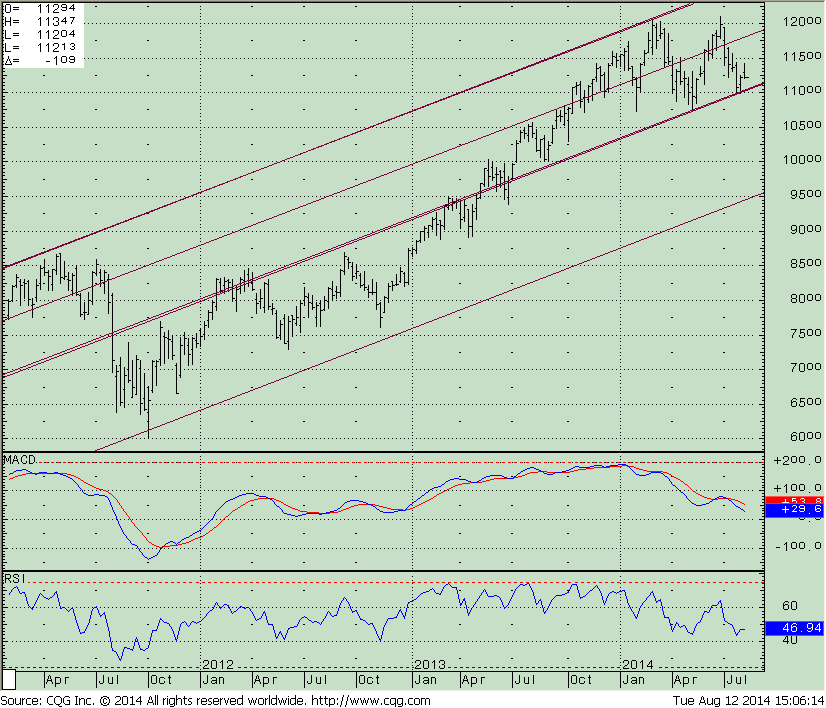
I believe the weekly chart of the Russell 2000 ETF (IWM) is more significant at this time. Notice how RSI failed to reach 70 or higher to signify strength when price peaked at 120.97. Price fell 9.2% from its high (July 1) to a low of 109.86 on August 1, 2014, breaking below the old support area at 112.50 but prices stabilized and did not drop much further. Instead prices have rebounded finding support at the weekly middle channel, in the 109 area, (Chart 2) now off of its lows trading at 113.25.
Weekly MACD has flattened and RSI has turned up, good signs, but both indicators did not reached true oversold areas from which the most promising buy signals originate: MACD below 0 and RSI below 30. If last week’s low of 109.86 is violated and prices drop below 107.50, (I’m giving some extra room in case of an overshoot) I would then expect a more serious decline to develop. Prices could fall to the first support between 102-105 and if the decline is more serious this area will not hold and price could go down to the channel objective of 95.00 approximately 15% lower.
Chart 2 : The iShares Russell 2000 Index ETF (IWM) Weekly Chart
Nasdaq 100 (QQQ) forms a negative divergence with its MACD
Another area to be monitored which I haven’t mentioned in months is the Nasdaq 100 Powershares QQQ Trust (Chart 3), a profitable area to be invested in this year that continues to be resilient. The weekly uptrend remains in effect from November 2012. Price continues to make highs but with MACD weakening, failing to confirm the high. This is a huge negative divergence formed over several months, a long enough period to make this seem significant.
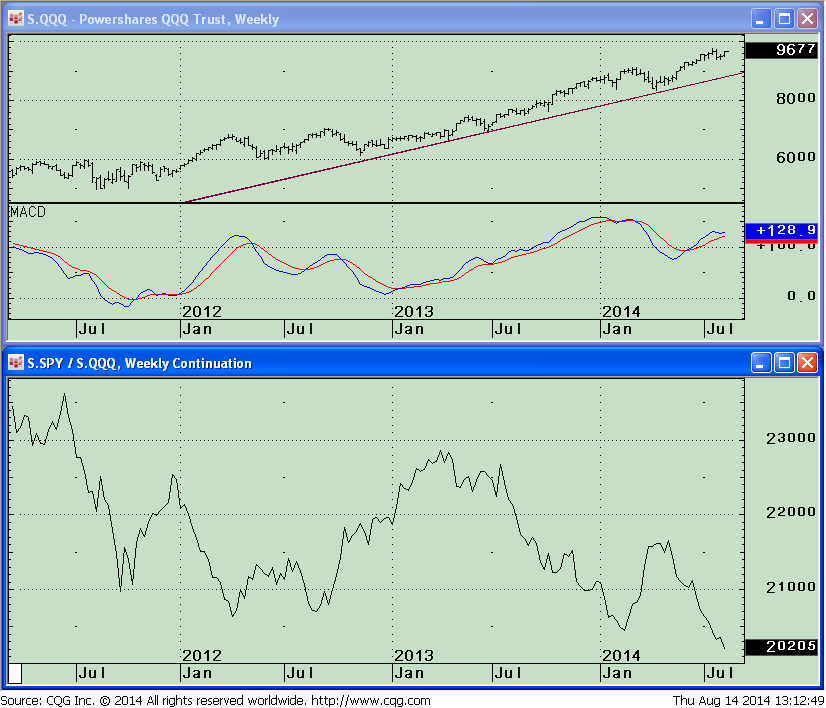
Chart 3: Weekly PowerShares QQQ Trust (top) and the Relative Strength Between SPY and QQQ
The lower chart is the relative strength ratio SPY/QQQ which I feel is noteworthy at this time. The S&P 500 ETF (SPY) is weaker than the Powershares QQQ.
I believe when this weekly relationship changes to the S&P 500 being stronger than the Nasdaq, a larger market correction will occur. The daily chart (not shown) also has divergences in the MACD and RSI which is disturbing. Be aware of a potential change in trend which could start if the Powershares QQQ breaks below 94.90, followed by 92.50 which correspond to the uptrend line in price on Chart 3.
Chart 3: Weekly PowerShares QQQ Trust (top) and the relative strength between SPY and QQQQ (bottom)
Just to Sum Up:
The market has recovered from its recent lows; selling pressure has subsided with the buy on market weakness mentality continuing. A key change in the market is that the daily trend is no longer in an uptrend which was supporting the market for many months. Technical indicators are not in the most favorable position with price below key moving averages on some market indices, and MACDs on longer term charts still looking problematic.
Small Caps continue to underperform. The market has stabilized for now but beware of the increasing possibility of more weakness ahead. If this latest rally fails and support levels are broken to the downside, especially on high volume, a more significant correction could occur. Key numbers to monitor if broken are 190.00 on The S&P 500 ETF (SPY), 107.50 on the Russell 2000 ETF (IWM) and 94.90 on the PowerShares QQQ Trust, (ETF) QQQ. Be the one who is prepared by having an exit strategy ready for a larger market correction in case the bears take control over the market with buying turning into selling.
If you need some assistance with your investments I invite you to call me at 844-829-6444 or E mail me at bgortler@signalert.com


Create more wealth in your life
with these simple strategies.
As an added bonus you will also
receive BG’s Updates and Ezine

Discover how to quickly create more well-being in your life with these simple strategies.
As an added bonus you will also
receive BG’s Updates and Ezine

As an added bonus you will receive BG’s Updates and Ezine

All work listed on BonnieGortler.com is licensed under a Creative Commons Attribution - Noncommercial - No Derivative Works 3.0 Unported License.
