

5 Investing Strategies to Save Money and Grow Wealth
04/11/2024
“Do not wait; the time will never be “just right.” Start where you stand, and work with whatever tools you may have at your command, and better tools will be found as you go along.” — Napoleon Hill
August has been a very strong month, better than I expected, with the S&P 500 index hitting the magic milestone 2,000 and The Dow Jones Industrial Average trading above 1,7000,- all making new highs. Internationals are acting better including the European region, with news of the prospect of new stimulus from the European Central Bank. Tensions in Ukraine during the month caused a brief decline, but key support levels were never violated. Charts had some negative divergences that were worrisome. The risk of a market correction appeared
to be increasing due to seasonality. Our models were neutral, but the market continued to climb. With the recent market strength our models are turning more favorable and seasonality will soon be positive.
It would be a good sign if investors moved into riskier assets, moved money out of the bond market and rotated into financials, international and small caps (sectors which have lagged the market). We are seeing improving strength in the financials (XLF) which broke its weekly down trend in late May 27th but then retreated. On this latest rally the financials hit their first upside objective of 23.40 that I mentioned in the June 20th newsletter. The next objective is 24.25. They could be the new leaders of the market, the catalyst that fuels the overall stock market higher the rest of August and into September, which is historically one of the worst months of the year.
What are the Charts Saying Now?
Chart 1 (right): Daily relative strength between XLF and SPY (top) and the 14-day RSI of this ratio (bottom).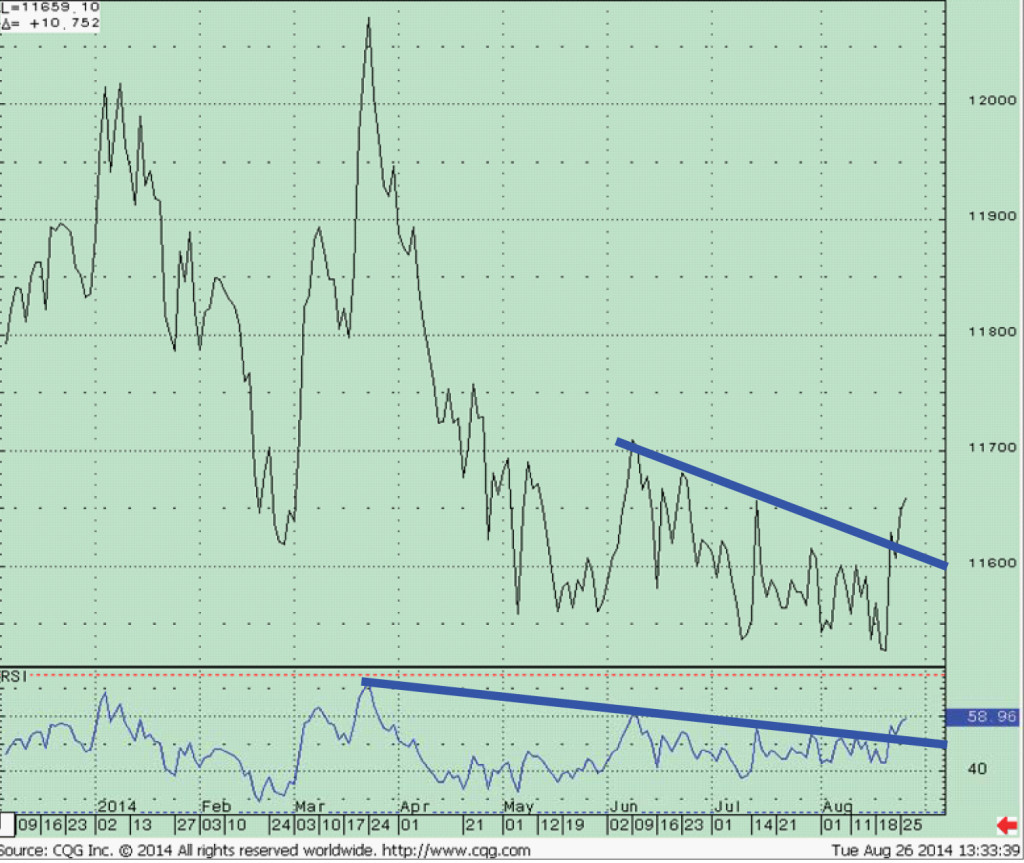
Financials were stronger early in the year but fell out of favor in late March. They are not among the best performers of the market this year. Prices bottomed in May but couldn’t sustain any real strength, failing in June2014. I have been waiting for the financial sector to show some signs of life that could lead the US market higher. This hasn’t happened but it appears a change could be taking place.
Notice the positive trendline break in the relative strength ratio of XLF/SPY, a clear change in trend. XLF is rising, now leading in relative strength and it just broke the down trend line on the top chart. RSI, another momentum oscillator, is at its highest level since June and also has broken the downside trendline since May.
The weekly relative strength chart (not shown) has also turned up from an oversold condition. All of these positive momentum changes bode well for investors who are looking for areas that have potential value the market to rise.
Chart 2:Weekly iShares S&P 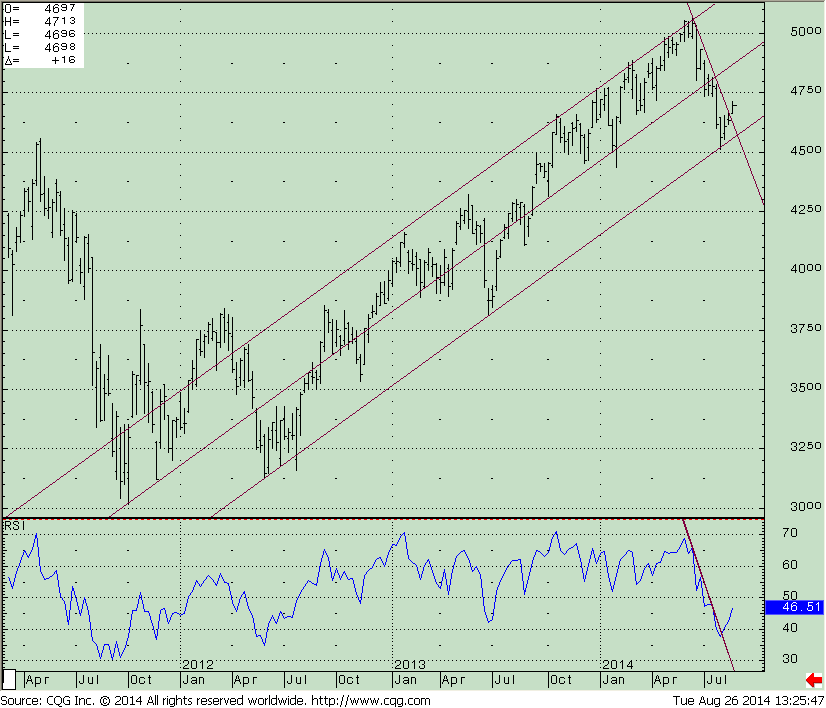
Europe 350 Index ETF (IEV) (top) and RSI (bottom)
Chart 2 shows the weekly iShares S&P Europe 350 Index ETF (IEV), an exchange traded fund that gives you a convenient way to have broad exposure
to European companies. The top five country holdings as of 08/26/2014 are United Kingdom 26.96% France 14.7% Switzerland 14.54% Germany 12.85% and the Netherlands 7.12%.
IEV peaked at 50.71 on June 16, 2014 finding support at the weekly uptrend from the May 21 low at 45.13 holding. Both price and momentum oscillators are confirming higher prices. The next objective is 49.00 and if we can get through, there would be a good chance the IEV would challenge the old highs of 54.14. A break below 45 would indicate a price failure which would have negative
implications going forward.
Chart 3: Daily iShares S&P Europe
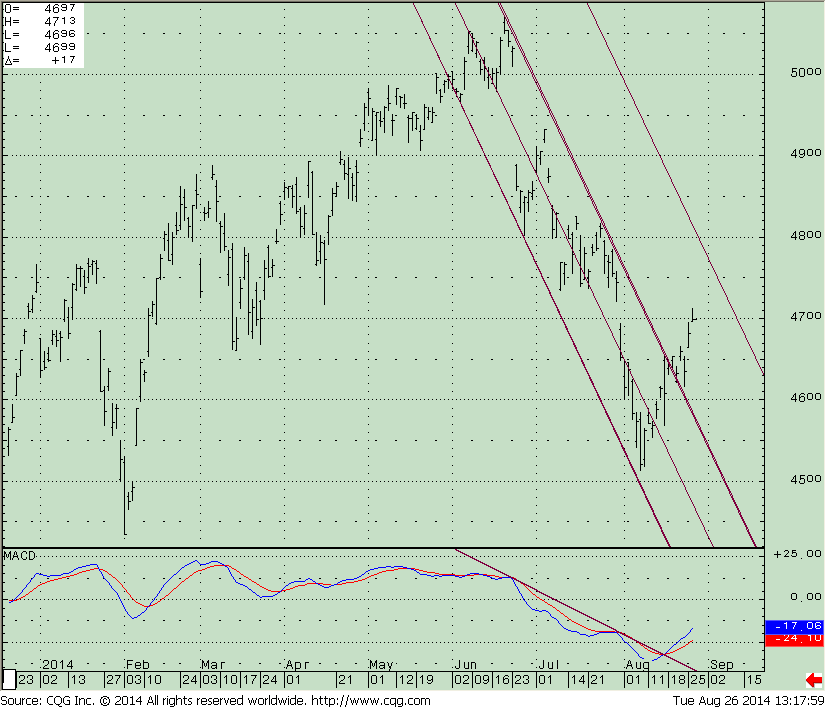
350 ETF (IEV, top) and its MACD (bottom)
The iShares S&P Europe 350 Index ETF (IEV) fell sharply down 11% from June 16, 2014 to its recent low on August 4, 2014. The shorter term trend is now up with the downtrend broken to the upside on the chart in price and MACD. The first objective is 47.80 which could happen within days if the market continues to factor in more central bank easing in Europe. The next objective aligns with the weekly objective of 49.00.
Just To Sum Up:
This rally has been stronger than anticipated. The stock market stabilized after a very short decline early this month, giving a bit of a scare but holding the key support areas of 190.00 on the S&P 500 ETF (SPY), 107.50 on the iShares Russell 2000 ETF (IWM) and 94.90 on the PowerShares QQQ Trust (QQQ). Market tape action has been very good on this latest rally during a time when historically the market is not favorable. Financials have improved, reaching their first objective and Europe could be next to join the party. A missing piece for the market had been the small caps which have recently been acting better. If the small cap area could be a leader and trade above 118.00 this would be positive and another sign for further strength ahead. With the present tape action it does not look like a market correction will happen. The bulls remain in control but I do recommend you to keep an eye on the market because the long term (monthly) price charts are extended and momentum patterns are rolling over. Even though I am optimistic, it is important to be ready for the unexpected.
Please share your stock market challenges or insights by calling me at 1-844-829-6229 or Email me at bgortler@signalert.com with your comments.


Create more wealth in your life
with these simple strategies.
As an added bonus you will also
receive BG’s Updates and Ezine

Discover how to quickly create more well-being in your life with these simple strategies.
As an added bonus you will also
receive BG’s Updates and Ezine

As an added bonus you will receive BG’s Updates and Ezine

All work listed on BonnieGortler.com is licensed under a Creative Commons Attribution - Noncommercial - No Derivative Works 3.0 Unported License.
