

5 Investing Strategies to Save Money and Grow Wealth
04/11/2024
The S&P 500 has made a new high and is now up over 8% for the year. September is historically a volatile and unprofitable month of the year. The risk of a market correction continues to loom in the back of most traders’ minds including myself. There has been no correction of 10% or more on the S&P 500 for almost three years. Momentum patterns on charts have been weakening during the past few months. Prices are trading near their upper ranges, generating overbought readings, but this hasn’t stopped the market’s rise. There will be a time when a larger correction occurs and profit taking takes place, but I don’t think it’s going to happen now. A short term pullback could occur, testing the recent highs but a serious decline is not expected as long as the monthly uptrend continues in effect.
The Nasdaq remains strong, gaining over 9% for the year and leading in relative strength vs. the S&P 500. The financial sector is acting better; small caps seem to have weathered the storm of investors not wanting to take on added risk and preferring large caps. Small caps have stabilized, and could be an area where traders look for value over the next few months. Buying short term weakness continues to be a profitable strategy for most sectors of the market. Our models have turned more favorable, and I am optimistic that prices will continue to work their way higher knowing the longer term trend is favorable.
What are the Charts Saying Now?
I thought now would be a good time to share the monthly Nasdaq chart that I have been following for an indication that risk is higher and the advance is over. The Nasdaq tends to be a leader of the market in strong bull markets. The Nasdaq Composite continues to make new highs trading at levels seen back in 2000. There is no doubt that the long term trend is up. Prices have risen since 2012 to form a clear uptrend. There has been a clean uptrend since 2012 and only a minor penetration of this uptrend line since 2008. Both are very significant lines to signify healthy market strength as long as they are not broken to the downside.
The lower part of the chart shows the 14 month RSI of the Nasdaq Composite which I think has a very significant up trend line that remains intact from 2008. However, the RSI has formed a negative divergence that needs to be monitored. Price has made a higher high but momentum in RSI is not confirming. No need to panic yet: RSI is still at a high level showing strength which is a plus.
I would turn more cautious if prices break below 4,250.00 (approximately 7.5% lower), the major trend would be in doubt and caution would be warranted. For now all is well, the trend is up, declines have been short term and most likely to be contained. The bulls remain in control.
Chart 1: Monthly Nasdaq Composite (top) and the 14-month RSI (bottom) 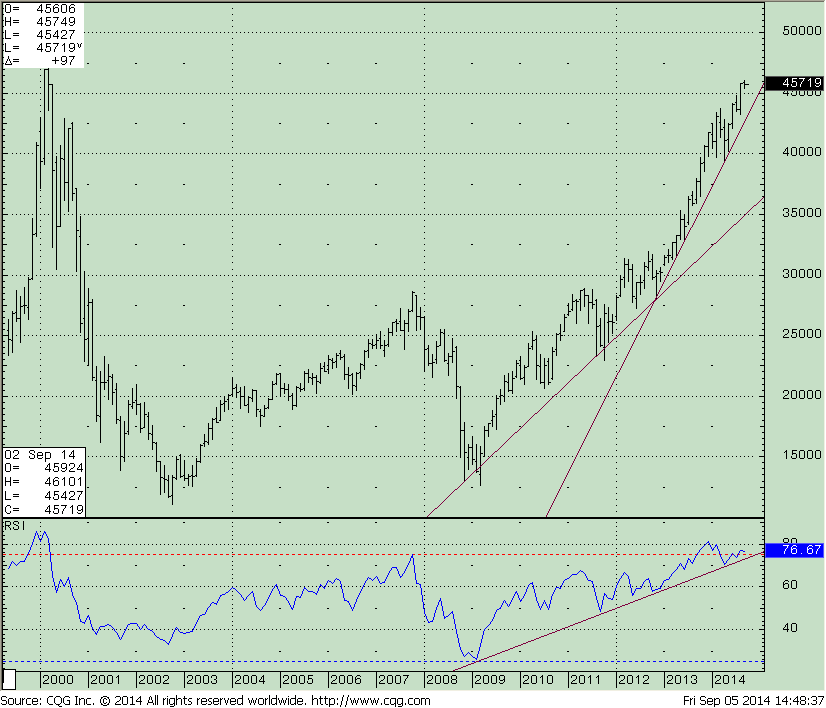
Chart 2: Monthly S&P 500
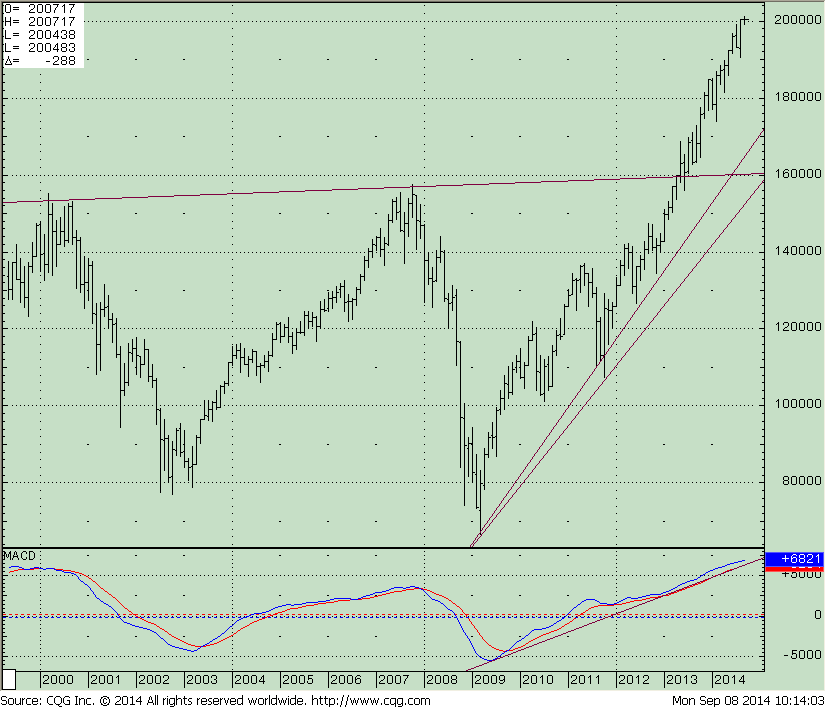 Index (top) and the MACD (bottom)
Another chart worth watching for a potential change in the trend that the advance could be coming to an end is the S&P 500 monthly chart. There is no doubt that the long term trend is up. Prices have risen since 2012 to form a clear uptrend. There has been only a minor penetration of this uptrend line since 2008 and a clean uptrend since 2012.
The S&P 500 has been very strong, never looking back once it penetrated through 1600.00, now major support. Price is not far from the first channel objective of 2030, followed by the complete channel all the way to 2460. On the lower part of the chart is MACD of the S&P 500 Index, a momentum oscillator. Although momentum is lessening, the uptrend remains intact from 2009 and MACD continues to confirm the highs. If investors were to begin to take some profits, a pullback to 1900 area could take place which would be a potentially good buying opportunity.
Just to Sum Up.
The Nasdaq and S&P 500 have both been good areas to be invested in this year. The market continues to be very resilient with the bulls in control. Market tops are hard to predict and take a long time to form. Although momentum patterns have given warnings over the year on short and intermediate term charts, the monthly chart is a good gauge of the market to determine how strong the market is and how long price trend continue. The longer term trend remains up both in terms of price and momentum oscillators such as RSI and MACD. I believe the monthly charts could tell us when a market correction is more likely to be more significant than what we have had so far this year. A decline has started as I am writing but I believe the decline will be short lived. If the monthly uptrend is broken then more caution would be warranted. As long as the up trends are in place ,short term declines are buying opportunities. The benefit of the doubt continues to go to the bulls.
I invite you to share your stock market insights by calling me at 1-844-829-6229 or Email me at bgortler@signalert.com with your comments.


Create more wealth in your life
with these simple strategies.
As an added bonus you will also
receive BG’s Updates and Ezine

Discover how to quickly create more well-being in your life with these simple strategies.
As an added bonus you will also
receive BG’s Updates and Ezine

As an added bonus you will receive BG’s Updates and Ezine

All work listed on BonnieGortler.com is licensed under a Creative Commons Attribution - Noncommercial - No Derivative Works 3.0 Unported License.
