

5 Investing Strategies to Save Money and Grow Wealth
04/11/2024
 The stock market had a broad sell-off during the first half of October, the worst since 2011. There have been warning signals of a potential decline for months,but it is only now that the decline has become a reality. Seven of the past ten trading sessions through October 15, 2014 have seen moves greater than 1%. Along with this increase in actual volatility, the CBOE Volatility Index (VIX) showed increased fear by more than doubling, going from 11.52, its lowest reading this on September 19, 2014, to a high of 24.64 on October 13, 2014. If investors and traders get more nervous, the odds favor even more wide daily swings to continue, probably through the balance of year. Stock market internals are getting worse, numerous divergences have formed, market breadth is poor, and new lows have increased sharply into the decline on heavier volume traded on the Nasdaq and New York Stock Exchange. Momentum patterns in many sectors are rolling over from extreme levels on intermediate and longer term charts. Key support levels that I have mentioned in the newsletter have all been violated, 190.00 on the S&P 500 ETF (SPY), 107.50 on the iShares Russell 2000 ETF (IWM) and 94.90 on the PowerShares QQQ Trust. The S&P 500 (SPY) and the Nasdaq Composite is now trading below its 200 day MA for the first time since 2012. With the recent sell-off, the market is now oversold, and a reflex rally could occur at any time. The most likely scenario is a rally back to resistance, or slightly higher. However, the appearance of intermediate and longer term charts suggests to me that the decline is not complete. Normally after the first thrust to the downside of a sharp decline, another test of the lows takes place over the next several weeks which is a safer entry.
Where Do the Charts Stand Now?
The Energy Select Sector SPDR ETF (XLE) had been a very strong sector, leading the stock market higher during the first half of 2014, but reversed sharply to the downside. On the way down, energy has been one the weakest sectors. XLE is a great example of why it is sometimes important to wait until the market actually finds a bottom and then turns up before bottom fishing. XLE tried to rally in July but failed to generate any real upside momentum and reversed down, making a new low each week. With this type of reversal, waiting to buy is better than getting stuck in a nasty decline.
Prices rose steadily from June 2013 with normal pullbacks along the way, a low of 54.26 peaking at 101.52 on June 23, 2014. From the peak, prices have fallen over 20% with not much of a bounce taking place. The uptrend was broken to the downside in September 2014. Price stopped rising for a few weeks had a quick rally but then a failure took place, forming a double top. A more serious decline followed. On the lower portion of the chart notice MACD rolled over in July and went accelerated down. The MACD oscillator, the lower chart is not quite in position for a safe entry. There are no double bottom formations or turn ups in place, but MACD has fallen below 0 which is a plus. More time and patience is required for a safer buy to occur. If the XLE could hold the channel objective 75 level this could support the US Equity market from continuing its decline.
Chart 1: Weekly Energy Select Sector SPDR ETF (XLE) and its MACD
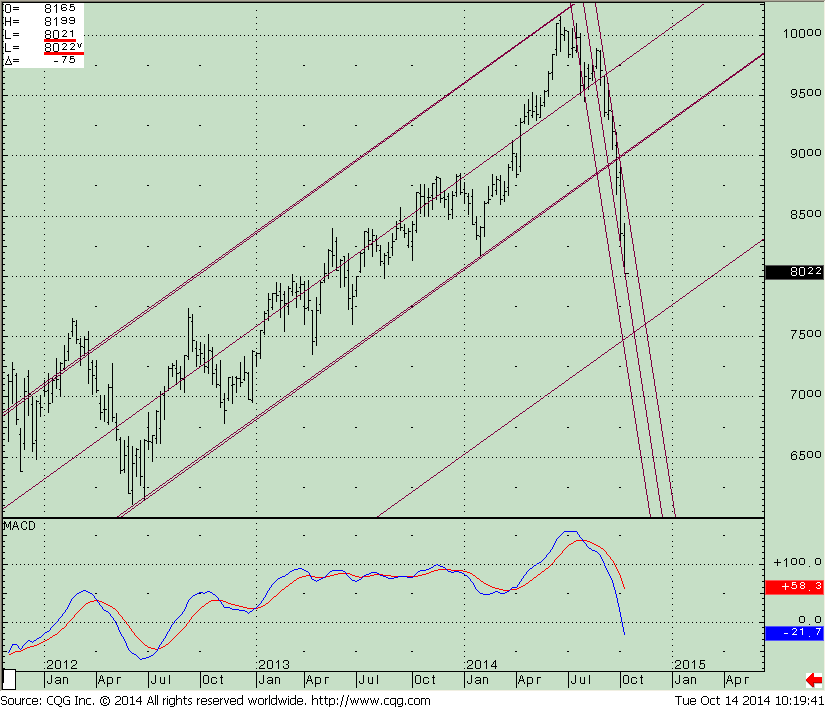
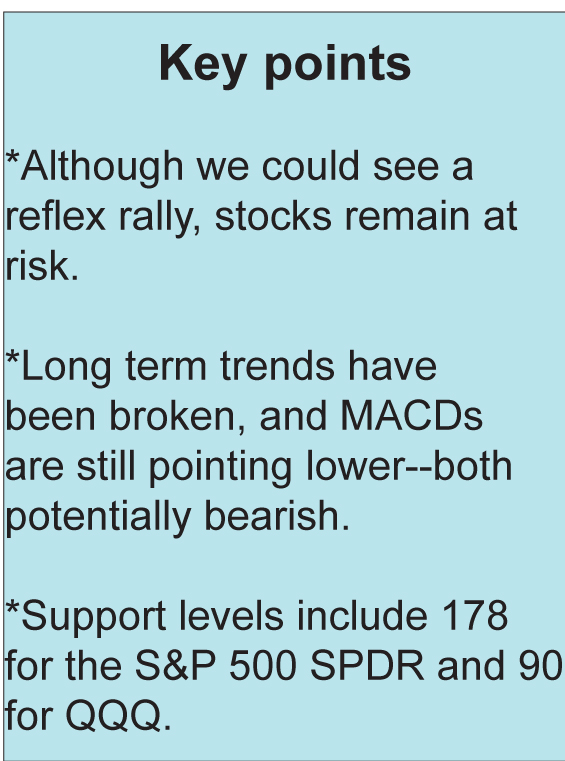
With the market selling off, is this a safe buying opportunity? Is the recent decline going to stop or will price continue lower? It looks to me like the S&P decline has further to go to the downside. The weekly price uptrend has been violated, now suggesting that the intermediate trend is down joining the long term trend. The channel downside objective is 178.00. Price could rally to where the market broke down from. If this is the case the SPY will have trouble getting through 195. Notice how the MACD oscillator is accelerating lower, weakening momentum with a negative divergence. There is no double bottom or turn up in place to suggest that now is a safe entry for a major bottom.
Chart 2: Weekly S&P 500 SPDR (SPY) and its MACD
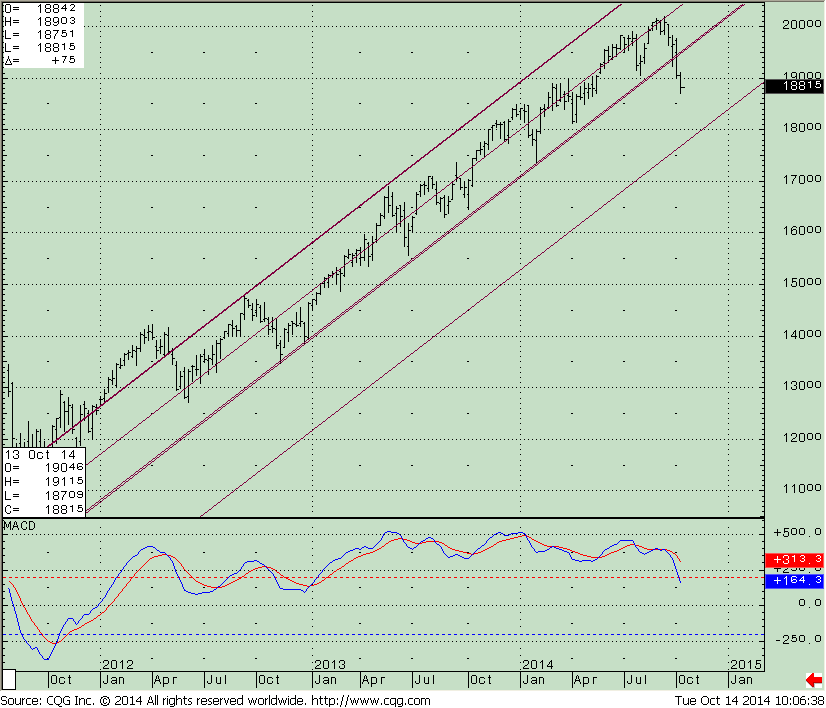
The Nasdaq 100 Index ETF (QQQ) has also been under selling pressure, breaking down through support levels and with MACD accelerating lower. QQQ traded near 100 but stalled after several times to make a further high in price. Price didn’t hold 94.00 where a bounce should have occurred. As of this writing the QQQ is now at 91.34 below where they traded in June 2014. If the decline continues from here the next support is 90, followed by 87.
Chart 3: Daily The Power Shares QQQ Trust Daily (QQQ)
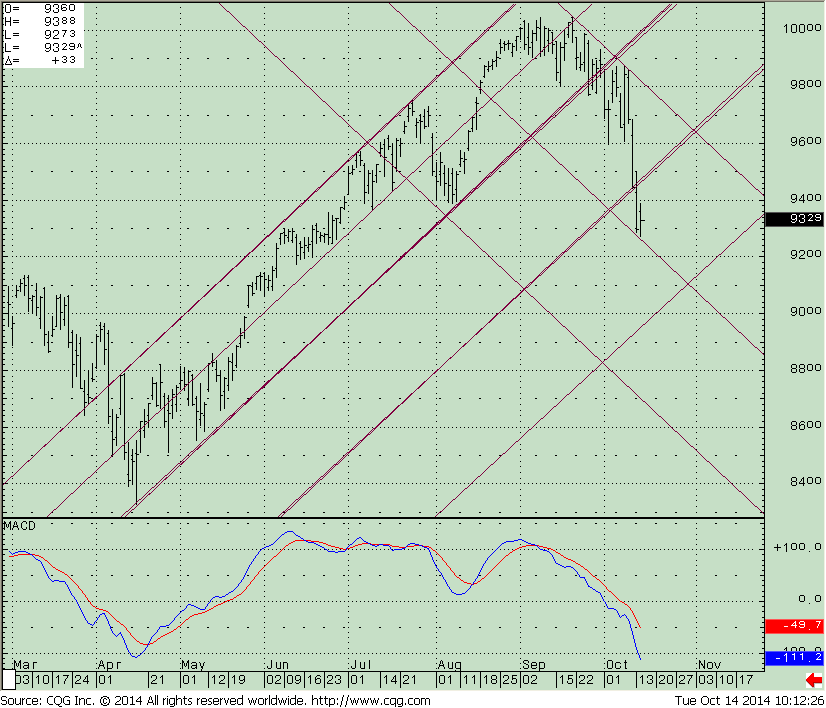
The decline that has occurred has been with Apple (AAPL) holding firm. If further selling were to take place in Apple (AAPL) this would put additional pressure on the Nasdaq 100 (QQQ) which has a 13.00% holding. A break below 92.50 on Apple would suggest further weakness for the Nasdaq 100 (QQQ) and would give a further warning signal that this decline could be more serious.
Just To Sum Up: The stock market has been under heavy selling pressure in October with wild intraday swings that have increased volatility and risk. The bulls and bears are in battle. It’s a bearish sign when, during the last hour of trading, prices stop rising; the traders are selling their investments into the close. Market breadth has deteriorated, numerous divergences can be seen on charts and many stocks are at new lows. The intermediate and longer term charts are rolling over from a topping formation, not in favorable buying position at this time and need some time before a safer buy could occur. Prices have had a sharp decline generating an oversold condition from where a reflex rally can occur at any time but it could also be a trap with more selling to take place. A safer buying opportunity is more likely to occur later on in the year. Favorable bullish months of November through January are just around the corner. Review your portfolio and reduce your holding with incremental changes that make you comfortable and allow you to sleep at night. I recommend that you focus on preservation of your capital. More short-term volatility and risk is expected.
If you would like to review your investments I invite you to call me at 844-829-6444 or E mail me at bgortler@signalert.com.


Create more wealth in your life
with these simple strategies.
As an added bonus you will also
receive BG’s Updates and Ezine

Discover how to quickly create more well-being in your life with these simple strategies.
As an added bonus you will also
receive BG’s Updates and Ezine

As an added bonus you will receive BG’s Updates and Ezine

All work listed on BonnieGortler.com is licensed under a Creative Commons Attribution - Noncommercial - No Derivative Works 3.0 Unported License.
