

5 Investing Strategies to Save Money and Grow Wealth
04/11/2024
The holiday season has arrived and it happens to be my favorite time of the year! An added bonus, the rally from the October 15 low continued in November with the S&P 500 and the Nasdaq breaking out of their consolidating patterns to the upside. This has not been the case for all areas of the market, with emerging markets, commodities such as gold and silver, and the energy sector under selling pressure. These markets are now oversold and could rebound at any time, but a safer buying opportunity could potentially develop later on in the year or early next year that could be more sustainable.
Where Do The Charts Stand Now?
Daily S&P 500 SPDR (SPY) 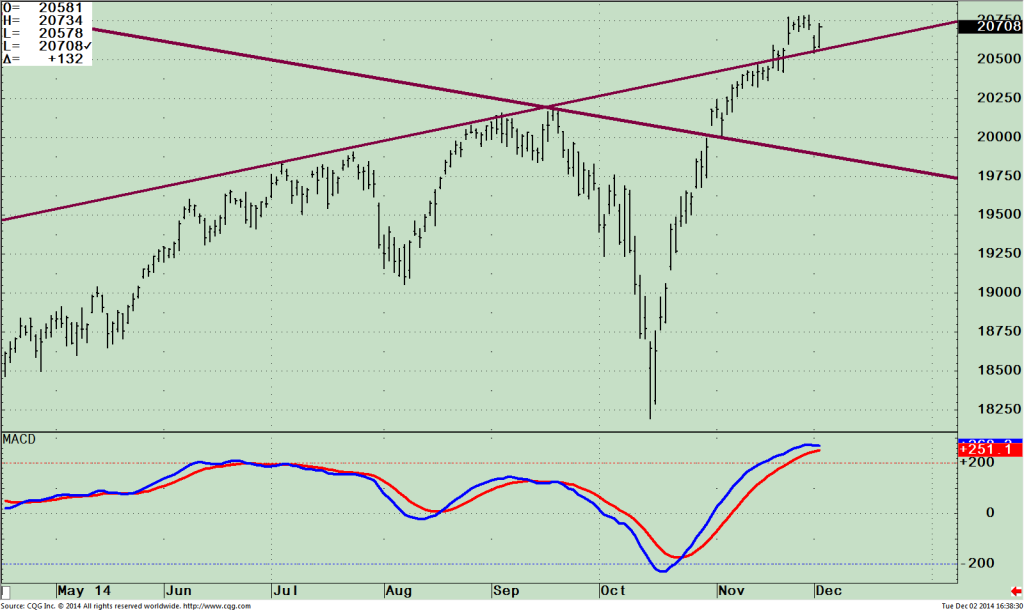
The market fell sharply in September but reversed higher after making a low on 10/12/14. A strong rally followed in a V formation, no pullback happened and the market kept going higher. Normally after sharp declines a test of the lows follows 3-6 weeks later. This has not occurred, with the S&P 500 only having a very small decline to the top of if its recent daily channel. (See top half of chart to the right.) No damage was done and I’m not expecting any major drop from here. Since we are in a favorable seasonal period for the market, and present volatility is low, the chance of a major decline is minimal and higher prices are likely. If a pullback were to occur now, a decline to 198.50 is possible where the S&P 500 tested its break out. If prices would hold there, it is a potentially good buying opportunity. Notice the bottom portion of the chart where MACD is rolling, but no negative divergence, and no sell has taken place. This is also bullish.
Weekly S&P 500 SPDR (SPY) 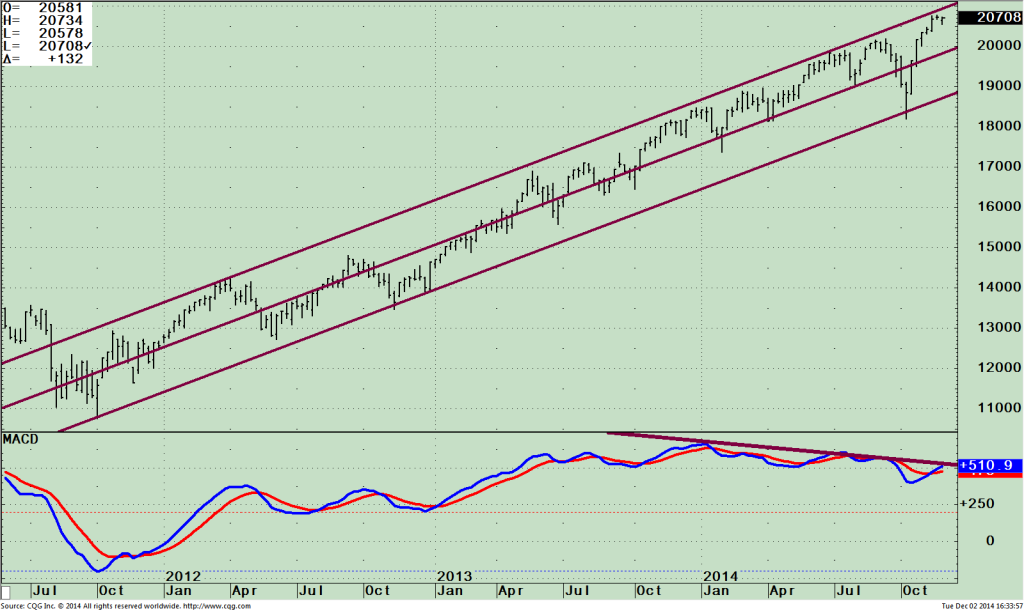
The weekly chart (right) has more worrisome features than either the daily or monthly chart, but I don’t expect the bearish potential of the weekly chart to be realized. See how the S&P 500 is trading near the top of its channel on a weekly basis. This could be an area where the rally stalls, but if the S&P 500 can penetrate the upper channel above 210 another leg up could start. Between 197.50 and 200 is a key support area, coinciding with the support area on the daily chart if a decline were to occur. MACD is overbought (well above zero), suggesting that the market could remain vulnerable. However, MACD has turned up, which is a plus, but so far has not broken the downtrend in momentum from January. If the MACD trend is broken to the upside this would also be favorable.
Monthly S&P 500 SPDR (SPY) 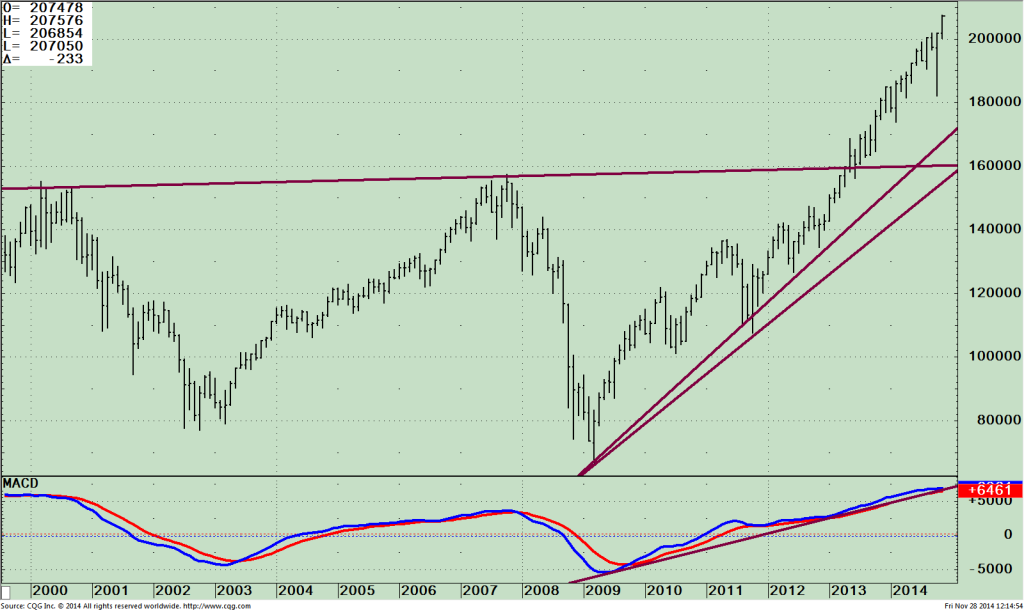
The monthly chart at the right shows that the long term trend remains up. Prices have risen since 2012 with only a minor penetration of the uptrend line since 2008. The market did have a quick sell-off in October that reversed back up quickly. With holiday spirit in the air, I am looking for the S&P 500 SPDR to move towards 220 quickly if 210 is penetrated. The major channel objective remains at 245, mentioned in the July 3 newsletter using a charting technique, the Andrew’s Pitchfork developed by Alan Andrews. (E mail me at bgortler@signalert.com for a copy of the newsletter article).
Just To Sum Up
Holiday season is upon us, historically a good time to be invested in the stock market. The S&P 500 (SPY) closed at 207.89 at the time of this writing, near its upper weekly channel. If the S&P 500 can penetrate the upper channel above 210 another leg up could start. Our models are positive, market volatility is low, and the odds of a major decline are minimal. Higher prices are likely as long as the S&P 500 holds above 198.50. The benefit of the doubt continues to go to the bulls.
I invite you to share your stock market insights by calling me at 1-844-829-6229 or Email me at bgortler@signalert.com with your questions or comments.
Wishing you and your loved ones health, wealth and happiness! ~Bonnie


Create more wealth in your life
with these simple strategies.
As an added bonus you will also
receive BG’s Updates and Ezine

Discover how to quickly create more well-being in your life with these simple strategies.
As an added bonus you will also
receive BG’s Updates and Ezine

As an added bonus you will receive BG’s Updates and Ezine

All work listed on BonnieGortler.com is licensed under a Creative Commons Attribution - Noncommercial - No Derivative Works 3.0 Unported License.
