

Bonnie’s Market Update 4/12/24
04/14/2024
September, historically the weakest month, proved to be volatile but ultimately profitable.VIX (S&P 500 Index Options Implied Volatility Index), which is a measure of fear, shot up during the final third of the month. As of this writing, VIX is above 18%, its highest level since June.
What the charts are saying now: iShares Russell 2000 Index ETF (IWM)
The daily chart of the Russell 2000 Daily chart (below, upper left hand corner) fell below short term support for one day, and has since reversed higher, taking out the high on September 18 of 107.09. This was bullish market action. The short term channel objective is 110, which coincides with the next short term resistance level on the weekly chart (bottom left corner).
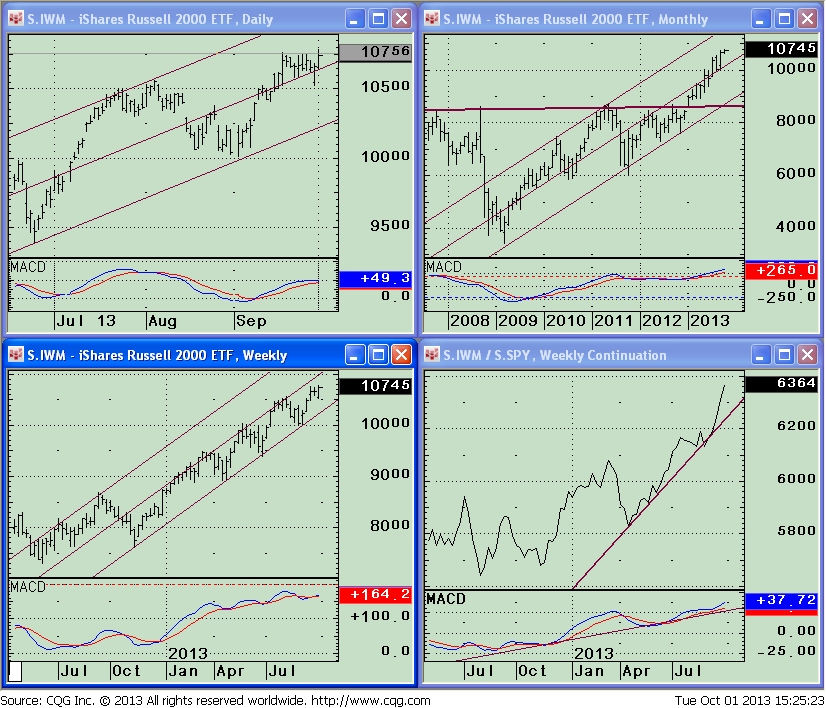
The IWM is clearly leading in relative strength. See the chart of IWM/SPY (bottom right) where the ratio is rising and at new highs. The MACD on the lower portion of the IWM/SPY uptrendline remains in effect and has not been violated to the downside. Also the ratio has started to accelerate, making a higher high confirming the recent strength, suggesting small cap leadership will continue. The top right chart shows the monthly IWM moving higher holding above 100 a key support area with a favorable MACD pattern, higher highs in momentum confirming the high. If we can penetrate 110, higher objectives will be given to 114 followed by 122.50.
More bullish charts suggesting further rally ahead
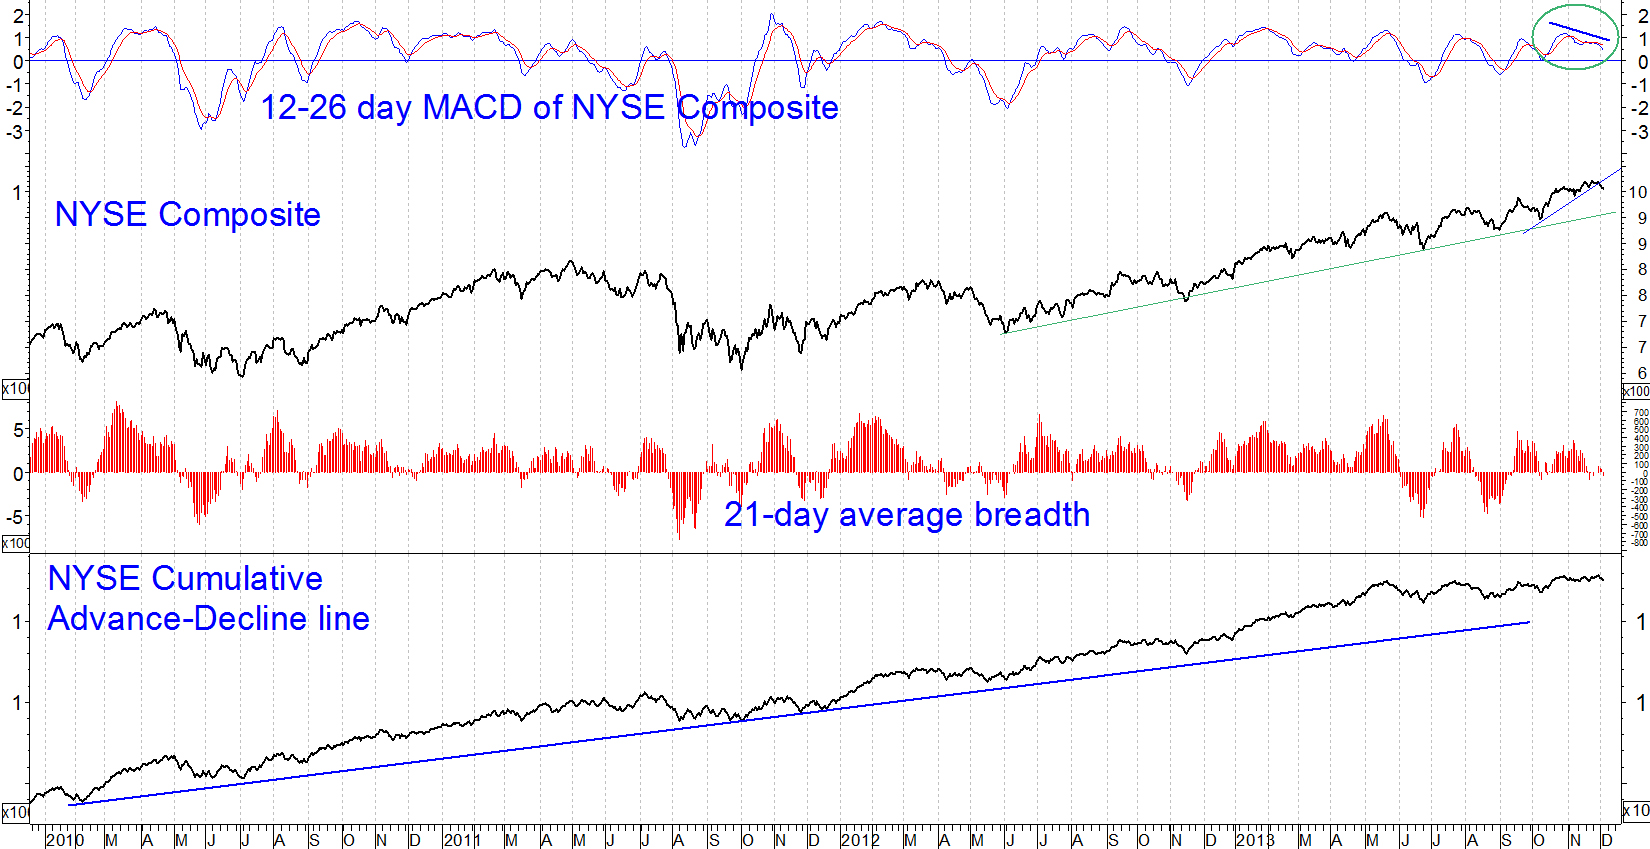
The top clip in the chart above shows the daily NYSE Composite Index (NYSE), which is made up of common stocks, American Depositary Receipts (ADR’S), and Real Estate Investment Trusts. After failing to confirm the highs made in July, the market made another high on August 13 but then stalled. The NYSE then fell to its low on August 30 before an ensuing rally to new highs in September. The price uptrend from June 2012 remains in place and is considered bullish.
The next two charts are based on the advance decline line, one of my favorite indicators to monitor because it measures stock market breadth, which I find very important when analyzing the internal strength of a market advance or decline.
The middle clip in the chart shows the 21-day average NYSE advances minus declines. It is showing a strong positive reading, even though it is not as high as the last rally. I will be watching to see if the advance continues, if we can make a higher high or if we will fail, suggesting further loss of momentum
The bottom clip in the chart is the NYSE Cumulative Advance Decline line. Each day that you have net advances the line rises and is added to the previous total. Conversely, it falls when you have net declines for the day and is subtracted from the total. The long term trend is up, with a clear up trend in place from 12/31/2010. Until this line is broken, declines will likely be contained and no major sell off will take place.
To sum up
Even with news causing uncertainty for the market, higher highs have been made with no significant decline. A budget deal has not happened as of this writing, the debt ceiling could become be the center of attention next week which could cause more volatility ahead. Earnings season is near, including Apple, which is scheduled to report on October 24. With market breadth indicators positive, small caps leading, new lows not expanding and uptrends in effect, I will give the market the benefit of the doubt for more gains ahead as we move into the fourth quarter.
Feel free to contact me with your thoughts or comments at BGgortler@Signalert.com.
Sign up now to receive FREE REPORTS about investing including
“Market Outlook 2013” at Signalert.com
This is a hypothetical result and is not meant to represent the actual performance of any particular investment. Future results cannot be guaranteed.
Although the information is made with a sincere effort for accuracy, it is not guaranteed either in any form that the above information is a statement of fact, of opinion, or the result of following any of the recommendations made herein. Readers are encouraged to meet with their own advisors to consider the suitability of investments discussed above for their own particular situations and for determination of their own risk levels.
Stay tuned, there are some great gifts coming your way during the October 24th launch of “Journey to Wealth” – A Practical and Mindful Approach to Growing and Sustaining Financial Well-Being. I’ll keep you posted of updates as they arrive in. Thank you in advance for all of your love and support. I’m so grateful!
To discover how to achieve your financial dreams click here
Visit www.BGJourneyToWealth.com for more insights to growing your wealth!

Bonnie Gortler (@optiongirl) is a successful stock market guru who is passionate about teaching others about social media, weight loss and wealth. Over her 30-year corporate career, she has been instrumental in managing multi-million dollar client portfolios within a top rated investment firm. Bonnie is a uniquely multi-talented woman who believes that honesty, loyalty and perseverance are the keys to success. You will constantly find her displaying these beliefs due to her winning spirit and ‘You Can Do It’ attitude. Bonnie is a huge sports fan that has successfully lost over 70 pounds by applying the many lessons learned through her ongoing commitment toward personal growth and development while continually encouraging others to reach their goals & dreams. It is within her latest book project, “Journey to Wealth”, where Bonnie has made it her mission to help everyone learn the steps needed to gain sustainable wealth and personal prosperity. Order your copy of ”Journey to Wealth” today!
- Subscribe to BonnieGortler.com
- Connect with Bonnie via LinkedIn, Twitter & Facebook
- Put a smile on someone’s face and Send a card on Bonnie!
- Choose your very own FREE down-loadable gift by visiting bit.ly/bgoffers
Like this post? Feel free to use it in your blog or ezine as long as you use the above signature in its entirety


Create more wealth in your life
with these simple strategies.
As an added bonus you will also
receive BG’s Updates and Ezine

Discover how to quickly create more well-being in your life with these simple strategies.
As an added bonus you will also
receive BG’s Updates and Ezine

As an added bonus you will receive BG’s Updates and Ezine

All work listed on BonnieGortler.com is licensed under a Creative Commons Attribution - Noncommercial - No Derivative Works 3.0 Unported License.
