

Bonnie’s Market Update 4/12/24
04/14/2024
“Anyone who is not investing now is missing a tremendous opportunity. ”Carlos Slim (Net Worth $69 Billion, May 2012)
Investors were nervous and concerned when a government shutdown was put in effect, causing increased volatility in the market and uncertainty. The CBOE volatility index (VIX, a fear index) rose to its highest level since June, hitting 21.34 on 10/09/13. Once the government reached a deal to resume operating, the stock market went higher; VIX quickly fell and then accelerated lower to 12.46 as of this writing. Political news has dominated the markets instead of company earnings which normally would have been the focus. Now, earnings can be the center of attention.
 What are the charts saying now?
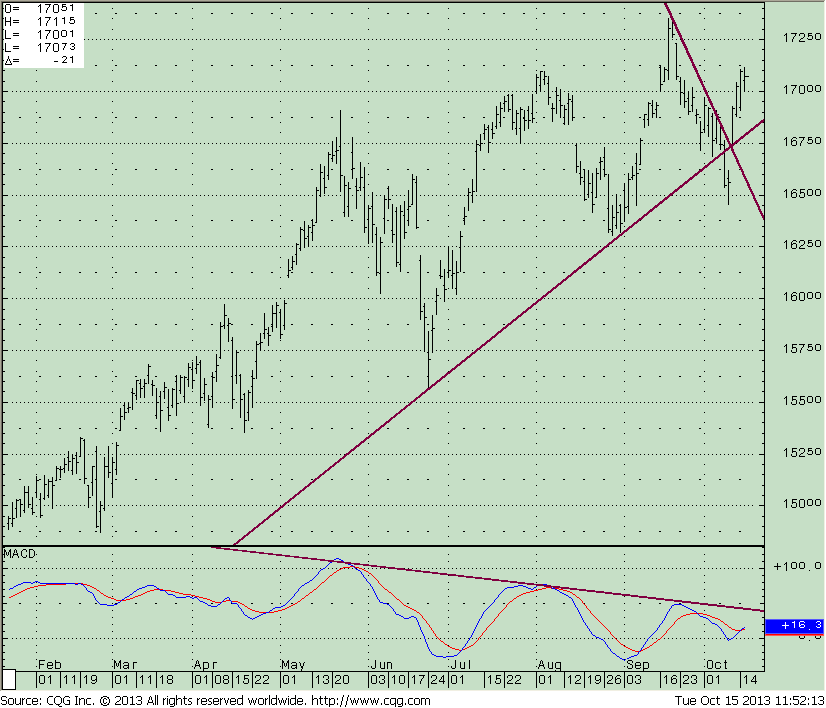
The S&P 500 SPDR (SPY) Trust Daily Chart
The chart to the right illustrates the S&P 500 SPDR (SPY) breaking the daily uptrend from June’s lows early in the month, failingto generate any downside momentum ofsignificance (a fake breakdown). Once again, SPY reversed to the upside, making new highs. Look at the MACD momentum pattern which looks very promising, with a turn up from below zero, a rising bottom formation, and a possible potential downside trend line break to the upside from the May peak. The short term upside objective is 176.00, and short term support is 167.50.
Weekly Relative Strength of the S&P
500 SPDR ETF Trust (SPY) Vs. Other Market Sectors
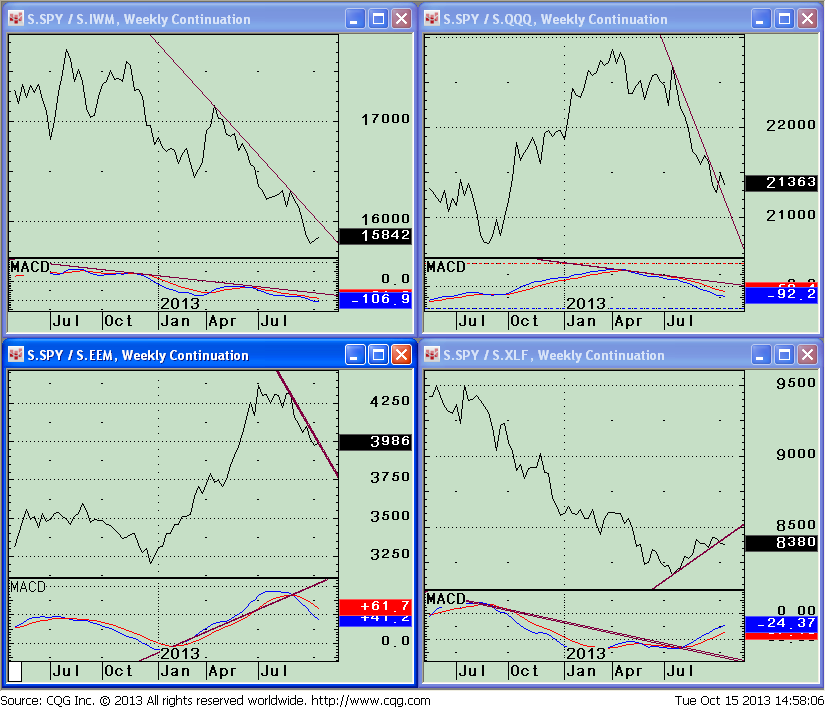
Insight from SPY/IWM ratio, top left: The S&P 500 SPDR (SPY) has been a profitable investment this year but turned weaker in relative strength vs. the small cap average iShares Russell 2000 Index ETF (IWM) in April. TheS&P 500 showed a sign of improved strength turning up September 30. With no trend line break to the upside confirming this shift in terms of price or momentum (MACD) I will continue to give the small cap average (IWM) the benefit of the doubt for continued out performance. This is bullish for the market, when small caps lead a market advance. As I wrote in the 10/4/2013 newsletter, if IWM penetrates 110 then the next upside objectives are 114, followed by 122.50.
Insight from SPY/EEM ratio, bottom left: The S&P 500 is trending down from March 25 and continued to lose relative momentum, with MACD on the lower portion of the chart continuing lower. Another good sign for higher prices for the overall stock market is when the emerging market area, iShares MSCI Emerging Markets Index ETF (EEM) is stronger than S&P 500.
Insight from SPY/ QQQ ratio, top right chart: The S&P 500 leadership peaked in April, and then lost more ground in July. The MACD of the SPY/QQQ ratio is still falling, suggesting that the relative strength trend favoring QQQ over SPY will continue. With Apple’s recent strength, a large holding that represents 12.4% of the PowerShares QQQ Trust (QQQ), relative performance has favored the QQQ vs. SPY. Apple is trading above $500, a huge resistance area where recent past rallies have stalled. Now that the $500 resistance level is penetrated, I am looking for Apple to move toward 550 the next objective which would help the QQQ continue to be the leader. ($500 is now a support level.)
Insight from SPY/ XLF ratio, bottom right chart: The S&P 500 had clear leadership over the financials from July 2012 to July 2013, at which point financials became stronger. There is a slight downside trend line break which could suggest another change, but I am going to give the benefit of the doubt to the Financial Sector SPDR (XLF) continuing to lead, as the MACD is confirming the financials’ leadership with a break of its downtrend.
In Sum
Small caps, technology and finance are strong sectors leading the advance, and emerging markets are leading the international area higher—all bullish signs, I continue to expect higher prices ahead. The market is resilient. The absence of selling pressure on pullbacks is forcing traders to pay up when adding to positions. Trend following indicators that I am watching remain bullish along with our timing models, suggesting risk will be contained on the downside into next year. I continue to give the market the benefit of the doubt as long as the SPY stays above 162.50 and the long term trend of the NYSE Cumulative Advance Decline line which we discussed in the October 4 newsletter remains in an uptrend. There is a good chance volatility could increase as the fourth quarter moves along but declines will likely be contained and no major sell off will take place in the market.
Feel free to contact me with your thoughts or comments at BGgortler@Signalert.com.
Sign up now to receive FREE REPORTS about investing including
“Market Outlook 2013” at Signalert.com
This is a hypothetical result and is not meant to represent the actual performance of any particular investment. Future results cannot be guaranteed.
Although the information is made with a sincere effort for accuracy, it is not guaranteed either in any form that the above information is a statement of fact, of opinion, or the result of following any of the recommendations made herein. Readers are encouraged to meet with their own advisors to consider the suitability of investments discussed above for their own particular situations and for determination of their own risk levels.
Stay tuned, there are some great gifts coming your way during the October 24th launch of “Journey to Wealth” – A Practical and Mindful Approach to Growing and Sustaining Financial Well-Being. I’ll keep you posted of updates as they arrive in. Thank you in advance for all of your love and support. I’m so grateful!
To discover how to achieve your financial dreams click here
Visit www.BGJourneyToWealth.com for more insights to growing your wealth!

Bonnie Gortler (@optiongirl) is a successful stock market guru who is passionate about teaching others about social media, weight loss and wealth. Over her 30-year corporate career, she has been instrumental in managing multi-million dollar client portfolios within a top rated investment firm. Bonnie is a uniquely multi-talented woman who believes that honesty, loyalty and perseverance are the keys to success. You will constantly find her displaying these beliefs due to her winning spirit and ‘You Can Do It’ attitude. Bonnie is a huge sports fan that has successfully lost over 70 pounds by applying the many lessons learned through her ongoing commitment toward personal growth and development while continually encouraging others to reach their goals & dreams. It is within her latest book project, “Journey to Wealth”, where Bonnie has made it her mission to help everyone learn the steps needed to gain sustainable wealth and personal prosperity. Order your copy of ”Journey to Wealth” today!
- Subscribe to BonnieGortler.com
- Connect with Bonnie via LinkedIn, Twitter & Facebook
- Put a smile on someone’s face and Send a card on Bonnie!
- Choose your very own FREE down-loadable gift by visiting bit.ly/bgoffers
Like this post? Feel free to use it in your blog or ezine as long as you use the above signature in its entirety


Create more wealth in your life
with these simple strategies.
As an added bonus you will also
receive BG’s Updates and Ezine

Discover how to quickly create more well-being in your life with these simple strategies.
As an added bonus you will also
receive BG’s Updates and Ezine

As an added bonus you will receive BG’s Updates and Ezine

All work listed on BonnieGortler.com is licensed under a Creative Commons Attribution - Noncommercial - No Derivative Works 3.0 Unported License.
