

Bonnie’s Market Update 4/12/24
04/14/2024
“The market is about money … Money flows in and the market goes up, money flows out and the market goes down.” –Jesse Livermore
Only two weeks ago the S&P 500 was at the top of its trading range, the semiconductors were at their highs (05/29/15 newsletter) and the technology sector was looking like it was ready for an upside breakout. Instead, semiconductors fell, and the Nasdaq 100 (QQQ) was unable to rally and close above the key 112.50 level, and the stock market reversed lower. Tape action started to get worse with energy, emerging markets and internationals weakening. The transportation average (IYT) fell to a new yearly low, market breadth weakened and the market looked like a larger decline would begin. There was heavy selling in the bond market with the 20 Year Treasury Bond ETF (TLT) accelerating its decline to a low of 115.25 on 06/10/15, down almost 17% from its peak on 01/30/15 at 138.50, adding further pressure to US equities. A short term pull back followed, with the overall market becoming oversold.
The financial sector (XLF) held firm though the decline. Also, the Nasdaq 100 (QQQ) held above key support at 107.50 signaling buyers to step in. In two days of trading the S&P 500 and the Nasdaq 100 (QQQ) rallied and are now with only three percent from their highs. With the intermediate and long term chart stock market patterns having shown a loss of momentum for many months, I am reevaluating whether to change my bullish bias. However, I am going to hold my ground for the time being as long as the financial sector continues to be strong and the technology sector holds support.
What Are The Charts Saying?
Weekly SPDR Financial Select Sector SPDR (XLF) and RSI14 (Bottom)
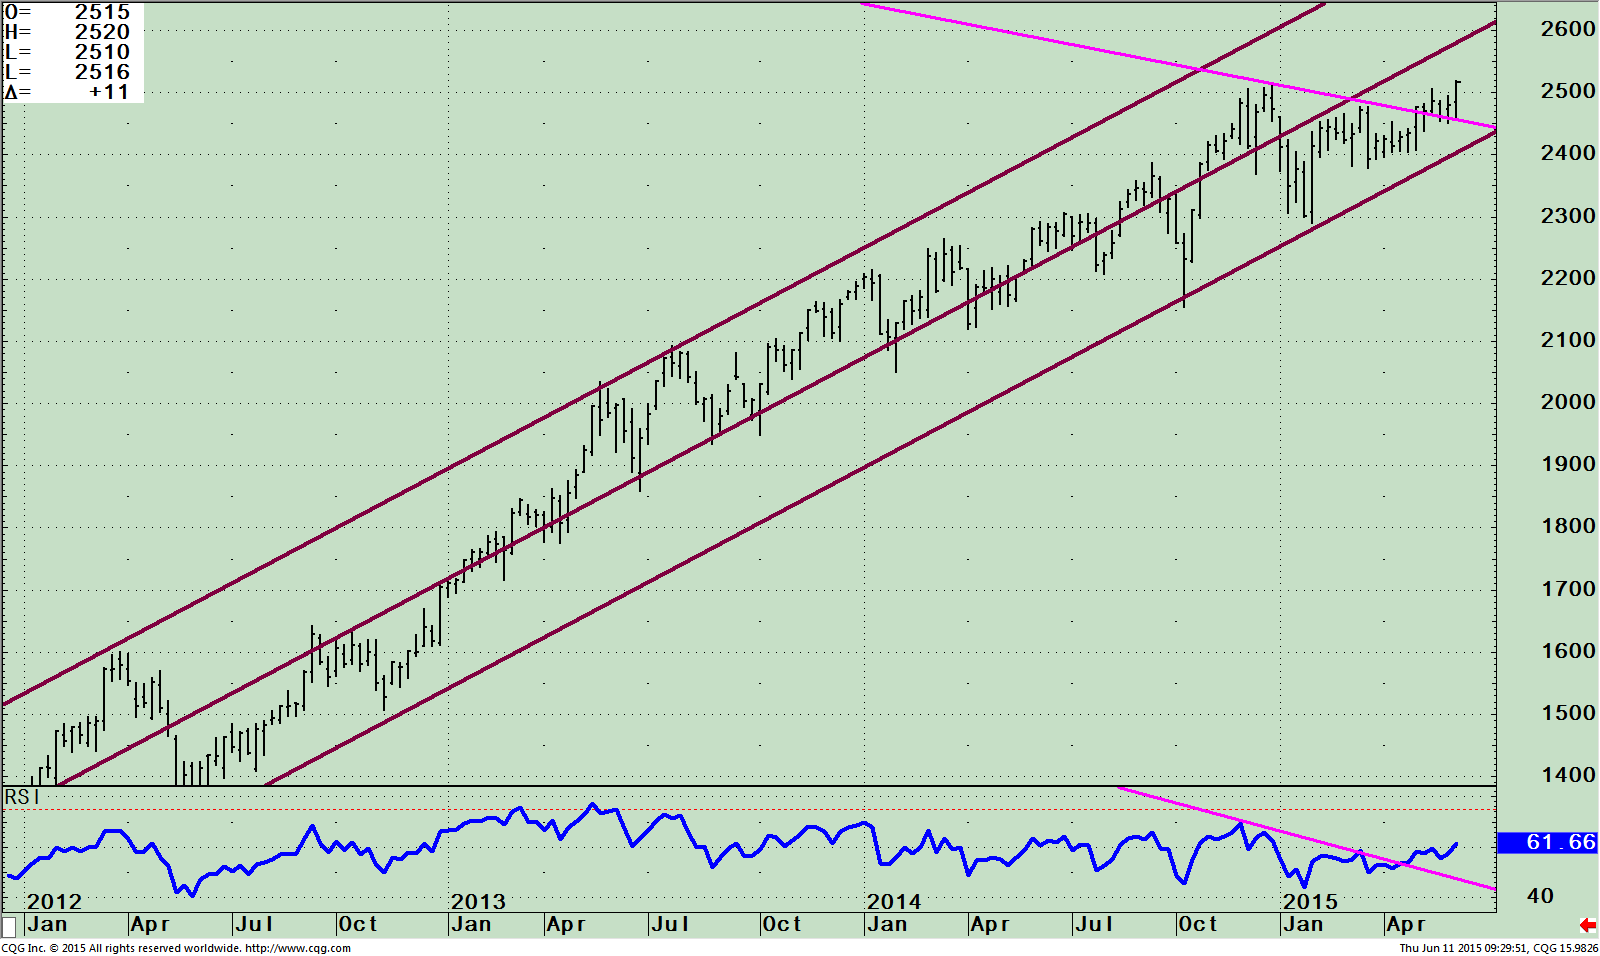
The top portion of the chart above shows the weekly SPDR Financial Select Sector SPDR (XLF) that looks to mirror the behavior of the financial sector of the S&P 500 Index. The Index includes companies from commercial banks, capital markets, diversified financial services, insurance and real estate. The top five largest holdings as of 06/09/2015 are; Wells Fargo & Co (WFC) 8.73%, Berkshire Hathaway (BRK.b) 8.36%, JP Morgan Chase & Co (JPM) 8.23%, Bank of America Corp (BAC) and Citigroup (C) 5.58%, representing 36.88% of the ETF. All the top holdings are at new yearly highs except Berkshire Hathaway which has been under pressure in recent weeks and is down 6.3% making a new yearly low on 6/9/15.
XLF has been in an uptrend since May 2012 and has now broken its short term trading range on 05/11/15. XLF paused for two weeks not giving up much ground retracing to 24.50, and then on 06/10/15 XLF made a new yearly high. The financial sector is looking strong, appearing to have broken out to the upside with further gains to go. This historically tends to be bullish for the market overall. The upside channel objective is at 26.00. If the XLF can break above then higher projections to 28.00 are possible. If XLF fails and goes below 24.00 there is a good chance the overall market will fall.
The bottom half of the chart shows The Relative Strength Index, a measure of momentum developed by Welles Wilder. RSI is based on the ratio of upward price changes to downward price changes over the last 14 weeks. RSI has broken the down trend (pink line), indicating that XLF is gaining momentum and is likely to continue on the same trend.
Weekly XLF/SPY Ratio (Top) RSI of XLF/SPY Ratio (Bottom)
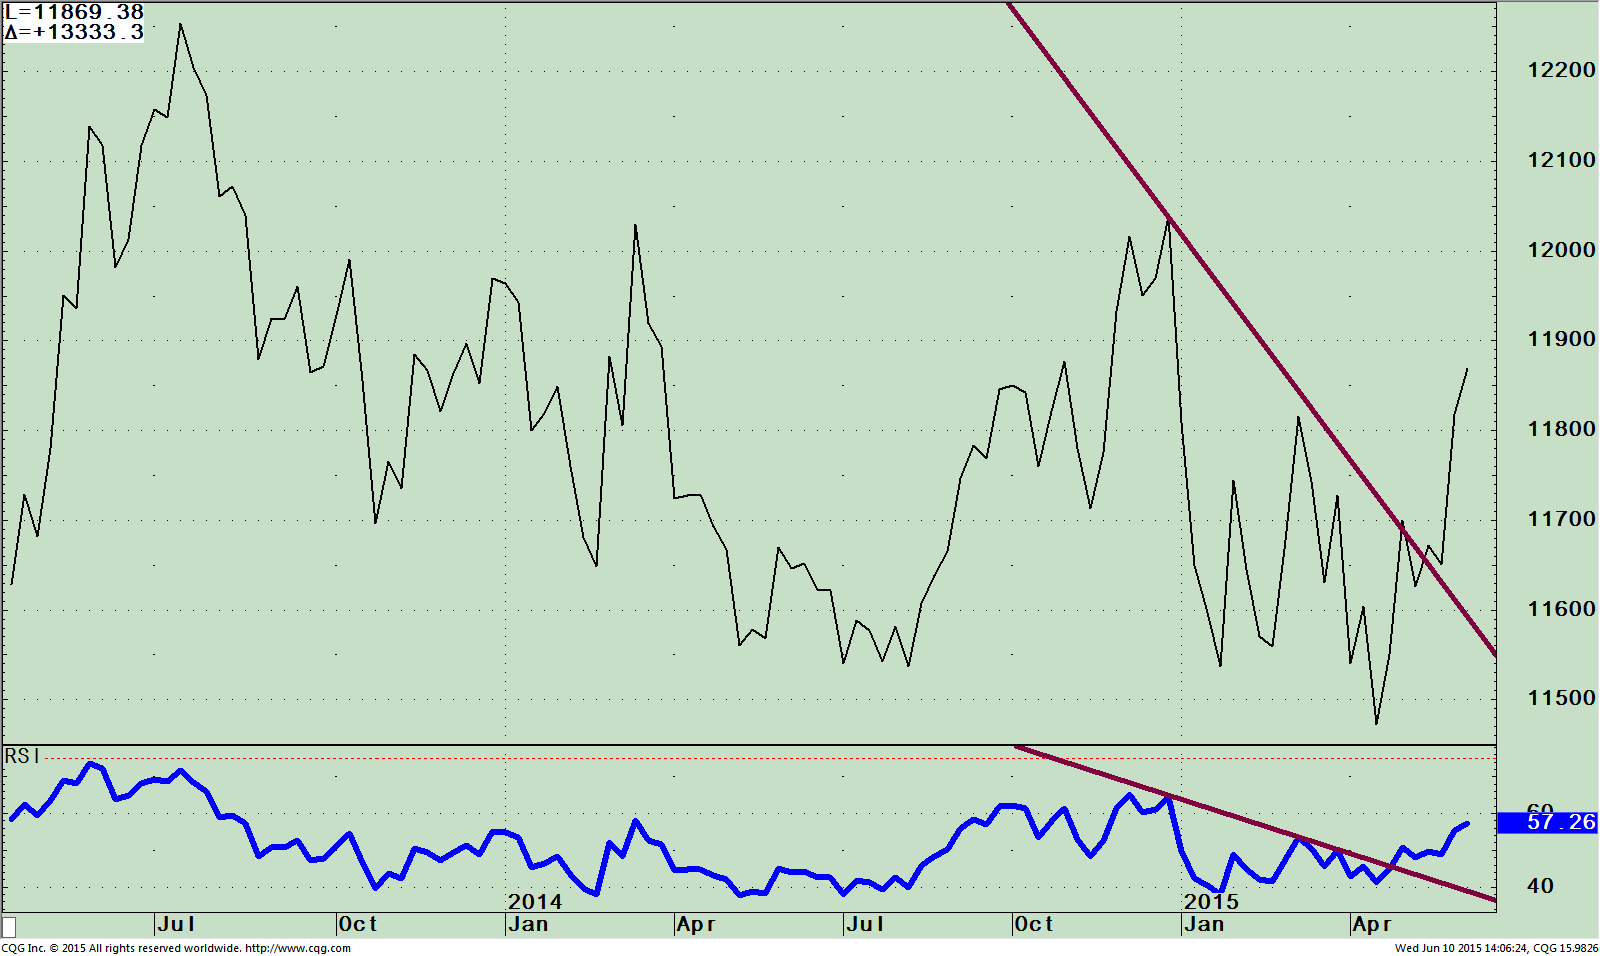
The top part of the chart is the weekly XLF/SPY ratio. A rising line means the XLF is stronger, and if falling, the S&P 500 is stronger. The line is rising sharply showing the strength in the XLF vs. the S&P. It’s bullish that the weekly ratio is at its high for the year, confirming the XLF price high.
The lower chart shows the RSI of the XLF/SPY ratio, also in favorable position breaking its downtrend from 2014, and rising to a new high for the year. This shows increasing momentum which is bullish and likely to continue.
Just To Sum Up:
The future of the stock and bond market with the potential of higher interest rates ahead continues to spook the market and has caused the S&P 500 to be in a tight trading range so far in 2015. The selling pressure in both the stock and bond market appears to have subsided but the jury is still out if the S&P 500 (SPY) will have enough strength to break out of its trading range. For the advance to broaden and gain momentum look for further strength in the financial sector (XLF) to rise to 26.00, and for the Nasdaq 100 (QQQ) to close above 112.50 for two days. In addition, if the 20 Year Treasury Bond ETF (TLT) stabilizes there will be a buying opportunity for interest rate sensitive stocks which have been under heavy selling pressure this year. A break below 114.00 in TLT would not be a good sign for the bond market and interest sensitive stocks. As long as XLF doesn’t fall below 24.00 and QQQ is above 107.50, look for higher prices in the stock market.
I would love to hear from you! Any thoughts, questions comments, feedback; please call me at 1-844829-6229 or
email at bgortler@signalert.com


Create more wealth in your life
with these simple strategies.
As an added bonus you will also
receive BG’s Updates and Ezine

Discover how to quickly create more well-being in your life with these simple strategies.
As an added bonus you will also
receive BG’s Updates and Ezine

As an added bonus you will receive BG’s Updates and Ezine

All work listed on BonnieGortler.com is licensed under a Creative Commons Attribution - Noncommercial - No Derivative Works 3.0 Unported License.
