

5 Investing Strategies to Save Money and Grow Wealth
04/11/2024
The stock market has started July with a bang. Unable to gather any upside momentum, the S&P 500 (SPY) has broken below the March lows and the Nasdaq 100 (QQQ) fell below its May lows. The S&P 500 (SPY) has fallen outside of its yearly trading range and below its 200 day moving average for the first time since 10/20/14. Emerging markets (EEM) are at their lowest levels since 2012. New lows are increasing reaching 300 for the first time since December 2014. Speculative higher risk areas of the market, such as oil (USO), emerging markets (EEM), and semiconductors (SMH) have fallen sharply from their highs, no longer leading in relative strength and now weaker than the S&P 500. This is not a healthy sign for the overall market. Wild intraday swings of 2% or more are happening more frequenty
and could continue. VIX (an index that measures fear) is increasing and also has had large daily swings of 10% or more. If this continues, daily trading swings will be wider, potentially more opportunity for those who want to bottom fish. There is more risk, so if you are wrong, the market will be less forgiving.
Technical indicators for the intermediate and long term that I follow continue to give warning signals by MACD. Uptrends are being broken, that is not inspiring me to get overly optimistic about the market moving higher this summer. This is normally not the most favorable seasonal time for the stock market to show large gains. One positive that remains is the Nasdaq 100 ETF (QQQ) and the Financial ETF (XLF), mentioned in the 06/26/15 newsletter, reversed on this latest decline right above their key support levels 105.00 and 24.00 respectively. As of this writing these levels have held, but it would be bearish if these levels indeed are broken.
Key Chart To Watch Now:
NYSE Cumulative Advance Decline Line (Top) and NYSE 21 Day Rate of Change Net Advance Decline Line (Bottom) since 12/31/2009
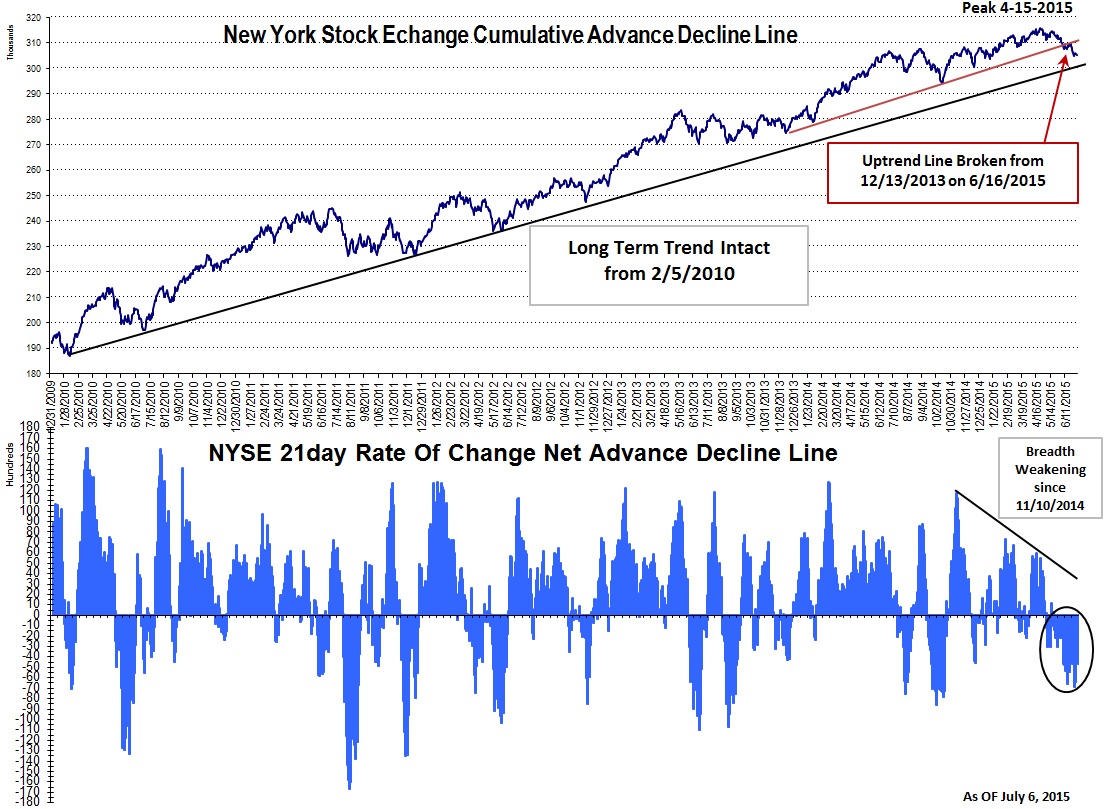
The top portion of the chart is the Cumulative Advance Decline Line of the New York Stock Exchange Index (NYSE) from 12/31/09, a running total of the number of stocks on the NYSE that rose minus the number that fell each day. Each day that you have net advances the line rises and is added to the previous total. Conversely, it falls when you have net declines for the day and is subtracted from the total. This is a stock market tool that I have used since the 1980’s in conjunction with other technical indicators such as MACD and RSI to analyze the internal strength of the stock market. When analyzed, these help see if the market is healthy and will rise further, or if the market might be vulnerable for a potential decline after a significant rise has taken place. Market tops are much harder to recognize or predict than picking a market bottom because market tops take a longer time for a bottom to form. If the stock market makes a high and the cumulative advance decline line confirms the high, many times a final top hasn’t taken place, and prices continue to rise or at least challenge the highs.
Notice that the cumulative AD Line peaked on 4/15/15, an advance warning of a peak in price that occurred two months later, with the S&P 500 making highs on 06/18/15. No new high has taken place in the cumulative advance decline line since then. In addition the uptrend from 12/13/2013 was broken on 06/16/15, not a good sign for the market. The good news is the long term trend is intact from 02/05/10. Until this line is broken, market declines will likely be contained, and the bull market is intact.
The bottom graph of the chart is the 21-day change in the advance-decline line. (NYSE advances minus declines). The 21-day change is an “oscillator” which crosses above and below zero, and which has ranged from roughly -16,000 to +16,000 since 12/21/09. Notice the 21-day change peaked on 11/10/2014, a clear warning sign showing downside momentum weakening. When the market rose early in 2015 the advance decline differential didn’t confirm the advance, meaning that fewer stocks were participating in the advance. This is one of the reasons that the market has gone sideways for most of 2015. The S&P 500 is only 4% from its highs. I will be watching to see if the 21 day rate of change stops making lows and starts to increase, which would be positive, or if it continues to stay negative, suggesting further loss of momentum and a continuation of the decline.
To Sum Up:
Wider trading swings up and down are occurring more frequently, raising anxiety levels for investors including myself. Our stock market timing models have changed to indicate risk is at its highest level of the year but will remain at least neutral-positive into next month. Market breadth indicators show signs that the market might have seen its peak. Risk of a further pullback is increasing with market breadth getting weaker, and more charts are showing momentum weakening. The decline in July so far has made the market oversold and a possible short term bounce could occur. The Nasdaq 100 ETF (QQQ) and the Financial ETF (XLF), mentioned in the 06/26/15 newsletter reversed on this latest decline right above their key support levels 105.00 and 24.00 respectively. As of this writing these levels have held, but it would be bearish if these levels indeed are broken. We are now at a critical juncture with more and more warnings signs being given. If the levels are violated, there is a good chance the trading range the market has been in this year would be resolving itself to the downside with the bears taking control. If you have not done so already, take a good look at your investments, and your potential risk. If the Nasdaq 100 (QQQ) and the Financial ETF (XLF) break below 105.00 and 24.00 respectively, I am recommending reducing your equity holdings by taking some money out of the market, and wait for chart patterns to improve and indicate a safer entry later in the year.
I would love to hear from you! Any thoughts, questions comments, feedback; please call me at 1-844829-6229 or email at bgortler@signalert.com.


Create more wealth in your life
with these simple strategies.
As an added bonus you will also
receive BG’s Updates and Ezine

Discover how to quickly create more well-being in your life with these simple strategies.
As an added bonus you will also
receive BG’s Updates and Ezine

As an added bonus you will receive BG’s Updates and Ezine

All work listed on BonnieGortler.com is licensed under a Creative Commons Attribution - Noncommercial - No Derivative Works 3.0 Unported License.
