

Bonnie’s Market Update 4/12/24
04/14/2024
The fourth quarter rally remains intact, with October a very strong month for the U.S. and international markets.
The strongest sectors (as of intraday on 10/27/15) are:
The Nasdaq 100(QQQ) +10.89%,
Korea (EWY) +11.30%, and
China (FXI) +10.12%.
The S&P 500 SPDR (SPY) is also is having a solid month, up 7.53%. The S&P500 (SPY) has penetrated short term resistance of 204.00, but has struggled to get through more resistance at 207.50 mentioned in the 10/02/15 newsletter.
The market rally has been broad, however small caps continue to underperform. The Russell 2000 Index (IWM) has gained only +3.86%, unable to penetrate resistance at 120.00, or generate any bullish thrust signals so far. If the IWM could get above 120.00 an upside objective to 130.00 would be given.
With the large advance this month, the market remains overbought and ripe for a pullback. It’s possible that the market could go straight up from here without a pullback, if the small caps get stronger sooner rather than later. November is one of the best performing months of the year. Also kicking in is favorable small-cap seasonality that historically begins late November which will support the market.
Where Do The Troublesome Patterns from the 10/25/15 Newsletter Stand Now?
Even with the gains from October, the long term trend remains unfavorable since so many indices broke their up-trends from 2009. With the recent rally, a potential bearish double top pattern could be forming if new highs are not made and the rally fails.
Our models have improved, but further confirmation is still needed to show that risk is constrained to produce a lower risk environment.
What Do The Charts Say?
SPDR S&P 500 (SPY) Weekly ETF (Top) and MACD (Bottom)
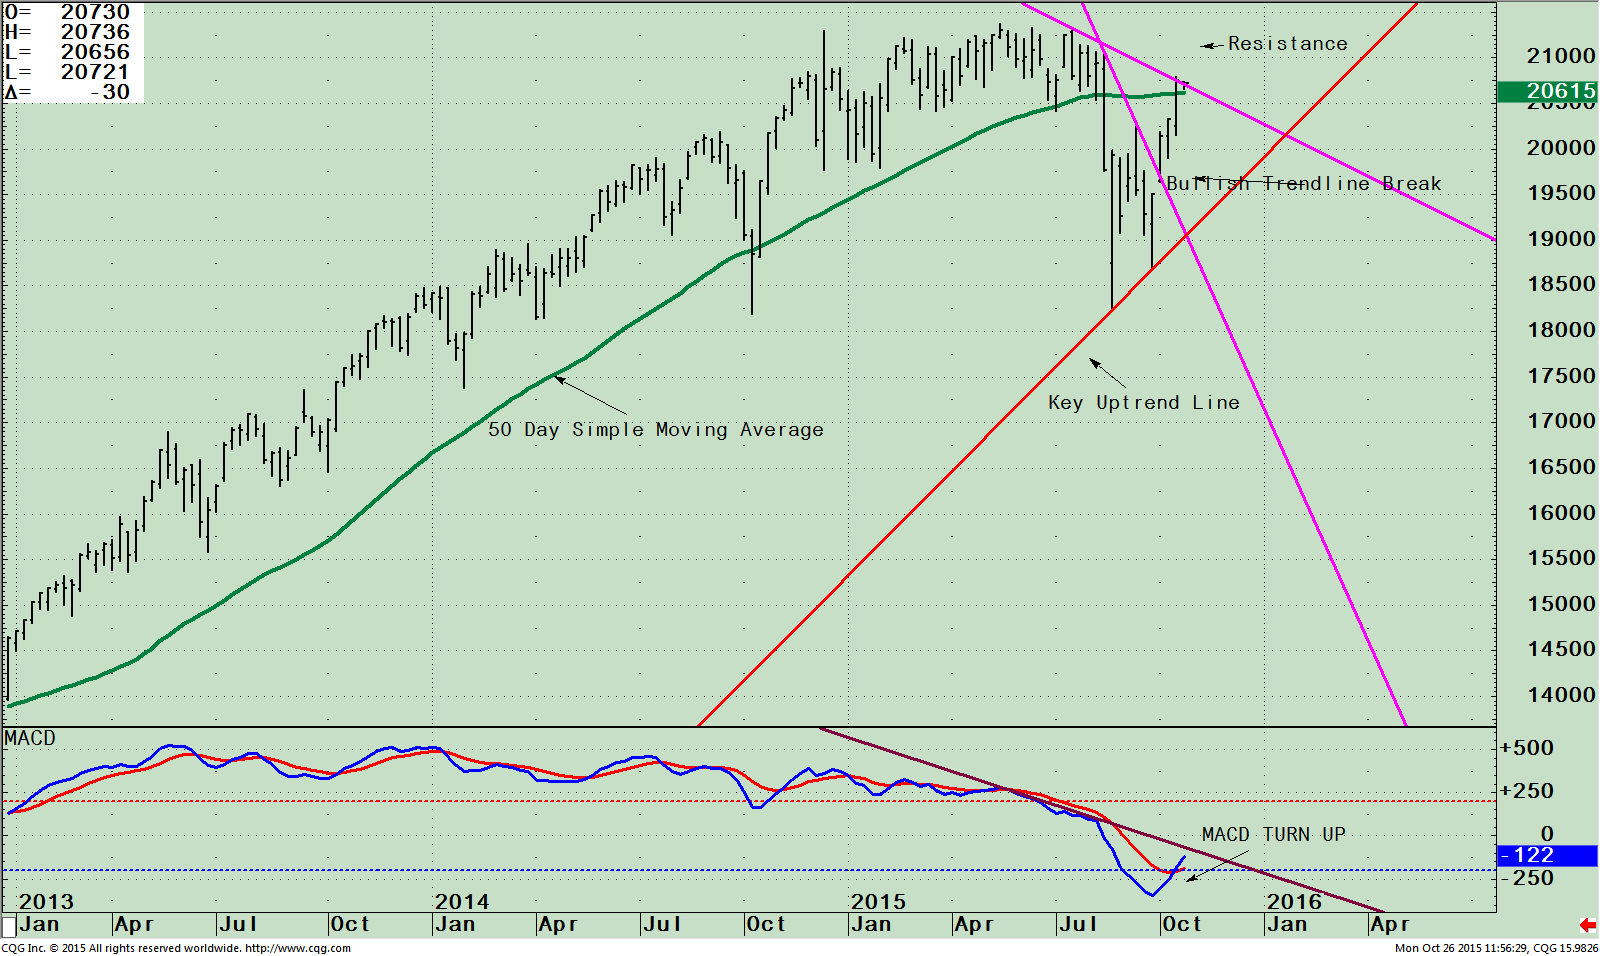
The top portion of the chart shows the weekly S&P 500 (SPY). I have drawn the key lines and areas that I am watching now for further direction of the market:
1. 50-day Simple Moving Average (green)
2. Key Uptrend Line (red)
3. Resistance
4. Bullish Trend Break (pink)
5. MACD Turn-up
The S&P 500 has rallied towards the 50 Day Simple Moving Average (green line), 206.15 (at the time of this writing) after successfully testing the August lows. If the S&P 500 (SPY) could get through resistance at 207.50 first, then 210.00 this would be a sign of strength and a move to 220 would be a real possibility.
If the market stalls now, a potential decline to 190.00 could occur in which the signifi cant up trendline (red line) and the bullish trend line break (pink line) are acting as key support.
A break below 184.00 would break the uptrend and the odds would increase that a serious decline would follow and potentially the 08/25/15 lows would be violated.
The lower portion of the chart is the technical indicator MACD, (a momentum indicator). MACD is below 0, oversold, and has turned up since the last newsletter advocating that this is a safe buy. The expectation is that the S&P 500 will continue to rise, and not go back down to test the lows again.
I still believe the bottom is in, and the fourth quarter rally has begun and is here to stay. I am expecting the S&P 500 to get through resistance at 210.00 and a broader market rally to develop.
Just to Sum Up:
I would love to hear from you! Please feel free to share your thoughts, ask your questions or share your comments with me. Please call 1-844-829-6229 or email me at bgortler@signalert.com.
*******Article in Systems and Forecasts October 29, 2015
This is a hypothetical result and is not meant to represent the actual performance of any particular investment. Future results cannot be guaranteed. Although the information is made with a sincere effort for accuracy, it is not guaranteed either in any form that the above information is a statement of fact, of opinion, or the result of following any of the recommendations made herein. Readers are encouraged to meet with their own advisors to consider the suitability of investments discussed above for their own particular situations and for determination of their own risk levels.


Create more wealth in your life
with these simple strategies.
As an added bonus you will also
receive BG’s Updates and Ezine

Discover how to quickly create more well-being in your life with these simple strategies.
As an added bonus you will also
receive BG’s Updates and Ezine

As an added bonus you will receive BG’s Updates and Ezine

All work listed on BonnieGortler.com is licensed under a Creative Commons Attribution - Noncommercial - No Derivative Works 3.0 Unported License.
