

5 Investing Strategies to Save Money and Grow Wealth
04/11/2024
U.S. equities have stalled, as they are still digesting the gains from the very strong October. Stocks that are sensitive to a rise in interest rates have been under pressure as investors rebalance their portfolios for the final weeks of the 2015. The good news is that historically, November is a favorable time for the stock market. The advance could continue sooner rather than later without a serious pullback. Presently many market indices are below their overhead resistance and if penetrated, the advance could broaden further.
10 Clues to Watch for:
1. Notice if new 52-week lows on the New York Stock Exchange go below 50. Even better would be if new 52 week lows go below 25 and stay there. (On 11/10/15 the reading was 84).
2. Market breadth on the New York Stock Exchange has been lacking. More advances than declines are needed for a broader rally. A consistent reading of more than 500 advances than declines each day the market rises would be a positive sign.
3. The CBOE Volatility Index (VIX) stays below 19.00. The VIX is a measurement of fear. As of 11/12/15 the intraday VIX is at 18.09.
4. Watch for a trading session in which there would be 9 to 1 more upside than downside volume on the New York Stock Exchange.
5. There is more advancing volume on the New York Stock Exchange on days when the market rises.
6. Overseas markets have been falling in recent trading sessions. If global markets could firm and turn up, this could support the U.S. market. Keep an eye on Emerging Markets (EEM) as a benchmark. Some key levels to watch and would be considered bullish are: if EEM stays above 33.00 and then rises above 36.00. (On 11/10/15 intraday the EEM looks to have firmed and is trading at 34.40).
7. The Value Line Geometric Composite, an unweighted average of roughly 1700 U.S. stocks has retraced some of its gains trading at 465.28 on 11/11/15. A rise above 473.00 would be a good sign that the short term pullback has ended and another rally attempt will occur. (On 11/12/15 intraday the Value Line Geometric Composite was at 455.50).
8. Investors may decide they want to invest in more risky areas of the market. Monitor the action in Healthcare (XLV) Biotechnology (XBI) Technology (QQQ) and Semiconductor stocks (SMH). Observe if these sectors are stronger than the S&P 500 (SPY).
9. High yield funds and high yield ETF’s have stopped rising, giving back some of their October gains. If they firm and start rising again it would be bullish for stocks. You can keep an eye on how the hi yield ETF’s (HYG) and (JNK) are doing intraday. They closed at 83.80 and 35.77 respectively on 11/11/15.
10. Watch to see if the Russell 2000 (IWM) shows more strength than the S&P 500 (SPY). If the IWM gets through resistance of 120.00, an upside objective to 130.00 is given. Small caps leading the market are important for further gains.
What Do The Charts Say?
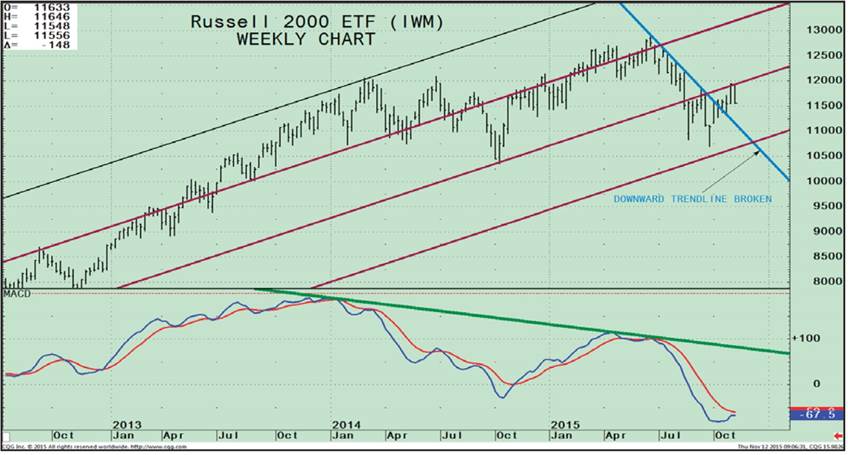
Ishares Russell 2000 ETF (IWM) Weekly Price (Top), and MACD (Bottom)
The top portion of the chart shows the weekly Ishares Russell 2000 ETF (IWM) made of companies with a market capitalization of between $300 million and $2 billion.
Small caps have lagged the S&P 500 (SPY) this year. The Russell 2000 (IWM) peaked on 06/22/15 at 129.10 and fell to a low of 108.26 on 08/24/15, and then made a lower low on 09/29/15 at 106.99.
The Russell 2000 (IWM) has stayed within a trading channel for the past 12 weeks, but it looks to me like it could be ready for a breakout to the upside. Notice the weekly downtrend has been broken, (blue line), a good sign. Historically the middle of November is a favorable time of the year for small caps to rally.
The IWM has stalled, unable to get through resistance above 120.00. If strength occurs in the IWM, then investors might be more interested in rotating assets from their existing holdings to small caps.
The longer term trend from the highs in October of 2014 remains in a down trend, (green line) but now the MACD is in a favorable position, oversold, below 0 and MACD is rising, soon to cross its signal line. If the IWM could get above 120.00 the IWM could easily go up towards the channel at 130.00.
Daily (IWM)/ (SPY) Ratio (Top) MACD of IWM/SPY Ratio (Bottom)
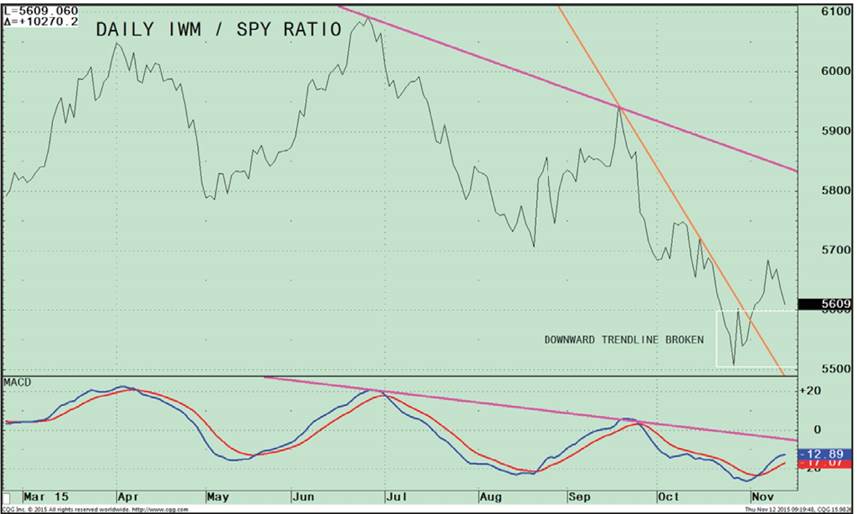
The top part of the chart is the daily Russell 2000 /S&P 500 Ratio (IWM/SPY ratio). A rising line means the IWM is stronger, and if falling, the S&P 500 is stronger.
The Russell 2000 (IWM) line had been falling sharply through late October. Now there has been a change, hope for the start of a potential rally for small caps. Notice the break of the down trend (orange line). A turn-up has taken place. Daily ratio charts are very sensitive to changes in market action, unlike weekly charts. In the past few days the market has been down, so the ratio has fallen slightly. If the ratio turns up in the next few days It would be bullish.
The lower chart shows the MACD of the IWM/SPY ratio, also in favorable position, breaking its downtrend from September 2015 (green line) and close to breaking the downtrend from July of 2015 (pink line).
More time is needed for confirmation that the Russell 2000 is ready to move toward its old high of 2015, but chart patterns are improving. Favorable seasonality could kick in at any time. Watch to see if the Russell 2000 (IWM) shows more strength than the S&P 500 (SPY) and can get through resistance of 120.00, giving an upside objective to 130.00.
Summing Up:
• U.S. Equities have stalled near overhead resistance and are working off the overbought condition from October’s large gains.
• With only a few weeks remaining until the end of the year, investors appear to be taking profi ts and rebalancing their portfolios for the final weeks of the 2015.
• Small caps stocks historically perform better in November. The Russell 2000 (IWM) has stayed within a trading channel for the past 12 weeks. Charting patterns are improving, but the all-clear signs are not quite in place yet.
• There could be a breakout to the upside on IWM sooner rather than later, if market internals start showing more improvement and investors become willing to take on more risk.
• In recent trading sessions the market has paused, and has not been able to generate enough strength to get through overhead resistance. However, favorable seasonality is upon us, and recent selling could turn into more buying, quickly.
• If the IWM could get above 120.00, the next upside objective would be 130.00.
• If the IWM turns down below the weekly channel at 105.00, then I would expect the bears to take control and lower prices would lie ahead.
It’s almost the end of the year. Need a second pair of eyes to take a look at your portfolio? Please feel free to call me at 1-844-829-6229 or email me at bgortler@signalert.com. I’d be happy to help.
*******Article in Systems and Forecasts November 12, 2015
This is a hypothetical result and is not meant to represent the actual performance of any particular investment. Future results cannot be guaranteed. Although the information is made with a sincere effort for accuracy, it is not guaranteed either in any form that the above information is a statement of fact, of opinion, or the result of following any of the recommendations made herein. Readers are encouraged to meet with their own advisors to consider the suitability of investments discussed above for their own particular situations and for determination of their own risk levels.


Create more wealth in your life
with these simple strategies.
As an added bonus you will also
receive BG’s Updates and Ezine

Discover how to quickly create more well-being in your life with these simple strategies.
As an added bonus you will also
receive BG’s Updates and Ezine

As an added bonus you will receive BG’s Updates and Ezine

All work listed on BonnieGortler.com is licensed under a Creative Commons Attribution - Noncommercial - No Derivative Works 3.0 Unported License.
