

Bonnie’s Market Update 4/12/24
04/14/2024
As the year comes to an end, disappointment, frustration and uncertainty are in the forefront of shareholders’ minds as they view their investments. It’s been a real challenge to make money in 2015. Concerns about how rising interest rates will impact the markets, as well as falling oil prices, – crude oil fell below 2009 lows after a 6 % drop on 12/08/15, – are unsettling investors. In addition, the European Central Bank asset purchase program was not as significant as hoped for, dampening investor spirits.
A rally attempt to get through resistance occurred when the S&P 500 (SPY) challenged past highs, stallingat 211.00 on 12/3/15. The Russell 2000 (IWM) went to 120.00 on 11/30/15, and 12/02/15 intraday, but the rally stalled quickly. With all the uncertainty in the market, a decline began and is still in process as I write.
Hopefully it will be short lived.
I recommend reviewing the newsletter on 11/25/15 in which I listed 10 clues for what is still needed in order for the market to penetrate new highs and get through resistance. (Feel free to E mail me at bgortler@signalert.com if you would like a copy).
Recently there have been wide intraday swings of 2- 4% that certainly get your attention. These swings present potential buying opportunities. By no means is the market out of the woods yet, with market breadth being weak, oil making lows, weakness in the high yield market, and international markets having difficulties.
The recent market tape action has been deteriorating and not improving.
However this can change quickly. A few positive signs include:
• Support levels are holding
• Favorable seasonality is upon us, and
• Equity models are neutral.
Our models could potentially turn more favorable in a few weeks if the market stabilizes. For now, I will continue to give the market the benefit of the doubt, but realize that I am concerned and feeling some fear based upon the latest action, more than I have been in many months. VIX (the measure of fear) has quietly risen, but is not at a high level (17.60 on 12/08/15), which is a good sign. Let’s revisit the weekly chart from 11/30/15 newsletter, which has been updated. (see next page) The top portion of the chart shows the weekly S&P 500 (SPY). I have drawn the important areas and key lines that I am watching.
SPDR S&P 500 (SPY) Weekly ETF (Top) and MACD (Bottom)
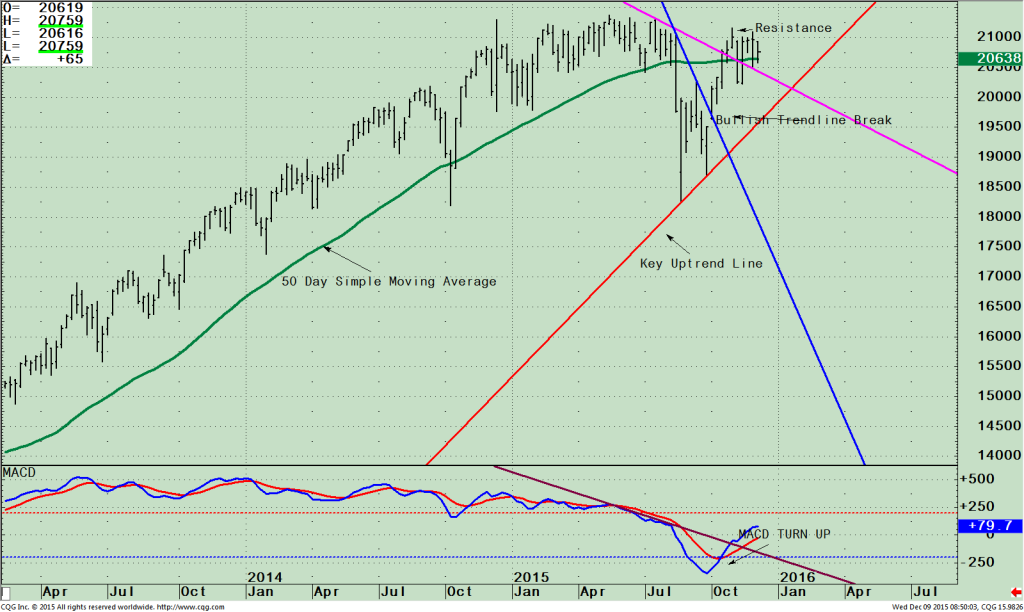
The S&P 500 (SPY) is hovering around its 50-day simple moving average (green) after getting above a few weeks ago, a positive sign. Overhead resistance remains, however the key uptrend line (red) is intact, also positive.
Each time the S&P 500 has rallied it has been unable to break through the resistance area above 211.50, and 213.78.
If the S&P 500 (SPY) gets through resistance, further upside projections to 229-230 exist. First support is at 202.50 followed by major support at 195.00 that would break the uptrend from July and increase the odds that a decline toward the old lows could occur.
If the decline materializes and 195.00 is violated, a more serious decline to 180.00 is a possibility (blue line) that would be a likely area to support the market.
The lower portion of the chart is the technical indicator MACD, (a momentum indicator). Notice MACD turned up from an oversold condition below 0, and has a clear bullish trend line break (pink) from May. Weekly momentum remains positive. The formation of MACD suggests the selling pressure that we currently have will stop soon, and the S&P will turn up to challenge the highs again.
Just To Sum Up
The start of December is not looking good. Poor market tape action is occurring in normally a historically profitable month. Market breadth is very concerning, more stocks are making new lows, and too few stocks are making new highs. It is bullish that key support levels and important up trend lines are intact.
Our equity models remain overall neutral and could improve if there is market strength.
I am continuing to give the market the benefit of the doubt; however I am more concerned by the latest market action than I have been in many months.
Keep an eye out for strength in the small caps. If small caps show some signs of leadership over the S&P 500, and if market breadth improves, it could signal increasing strength.
Review the clues needed for overhead resistance to be violated, as listed in from the last newsletter.
Watch the price levels of the S&P 500 (SPY), and the Russell 2000 (IWM) to see if investors shift from selling to buying stocks for a potential year-end rally.
A break through 211.50 and 213.78 on the S&P 500 (SPY) would give further upside 229.00 – 230.00 area.
If the Russell 2000 (IWM) could get through 120.00, this would be positive, giving an upside objective to 130.00. If oil continues to fall, if high yield bonds get weaker, if financials, healthcare, biotechnology, technology fall out of favor, then stocks will move lower.
If the S&P 500 (SPY) remains above 202.50, the year-end rally is possible!
It’s almost the end of the year. Need a second pair of eyes to take a look at your portfolio? Please feel free to call me at 1-844-829-6229 or email me at bgortler@signalert.com. I’d be happy to help.
*******Article in Systems and Forecasts December 11, 2015


Create more wealth in your life
with these simple strategies.
As an added bonus you will also
receive BG’s Updates and Ezine

Discover how to quickly create more well-being in your life with these simple strategies.
As an added bonus you will also
receive BG’s Updates and Ezine

As an added bonus you will receive BG’s Updates and Ezine

All work listed on BonnieGortler.com is licensed under a Creative Commons Attribution - Noncommercial - No Derivative Works 3.0 Unported License.
