

Bonnie’s Market Update 4/12/24
04/14/2024
Intraday volatility is widening in several market sectors as 2015 is coming to an end. During the first half of December, market advances were short lived, with not much follow through to the upside. The market lacked upside momentum, with poor market breadth signifying more stocks were down than up.
Oil prices were under heavy pressure.
Investor spirits were negative after the U.S. Federal Reserve’s first interest rate hike in 9 years. Looming in investors’ minds is the question of what pace, when, and how many times the Fed will raise interest rates next year. Early in December I was concerned about negative market and investor psychology, and that the major averages such as the Nasdaq 100 or the S&P 500 (SPY) have large holdings in Apple, which has been falling and out of favor since making a high on 7/20/15 at 132.97. Apple is now trading at its lowest level since 08/26/15.
Also not helping the market is that the S&P 500 (SPY) was unable to break through resistance above 211.50. Instead it turned lower, breaking below the first support level at 202.50 with a low of 199.67 on 12/18/15. The jury is still out on whether there will be a break out to the upside or if prices will stall again. (See the 12/11/15 newsletter article “Year End Rally Is Possible” for clues needed on which way the market will break out.)
As I write, I am hopeful the year-end rally is taking place, giving bulls the benefit of the doubt, and that the rally will continue to end the year and take us into January. The bright spot is the support at 195.00 is holding keeping the weekly uptrend from July intact. The S&P 500 (SPY) resistance is in the 204 206.00 area, a little above current levels. If the S&P 500 (SPY) were to resume its decline, then I would like to see the 198.00-200.00 area hold. With the decline that has occurred, technical indicators are now short-term oversold and in good position for a meaningful rally to begin. If small-caps could turn up, and strengthen relative to the S&P500 (SPY) this would be a helpful sign for the overall market.
If oil stabilizes, and there is more upside than downside volume on the News York Stock Exchange, it indicates that traders are more interested in buying rather than selling stocks.
Additional investor excitement could fuel another leg up, challenging old highs again and possibly surpassing them this time.
In the meantime, 2016 could be a time for investing in distressed sectors of the market, which is risky but could present interesting opportunities. With the end of the year almost here, I thought it would be a good time to identify some ETF’s of these oversold sectors, as shown on long term charts.
As of 12/22/15 these are four ETF’s which have fascinating recent patterns:
1. Emerging Markets (EEM)
2. Energy (XLE)
3. Gold (GLD), and
4. Silver (SLV).
All four ETF’s are oversold, have been beaten down, and are out of favor with investors. They appeared to represent buying opportunities coming into 2015, but rallies never materialized and they moved lower. They are more intriguing because they all have growth potential of double digit gains in 2016. Much of the risk has most likely already occurred in 2015. When prices stabilize and reverse, a sustainable tradable rally could materialize. Watch and be aware of when money will start to shift into these sector ETFs (EEM, XLE, GLD, and SLV) and gain more visibility from investors, instead of money
moving out.
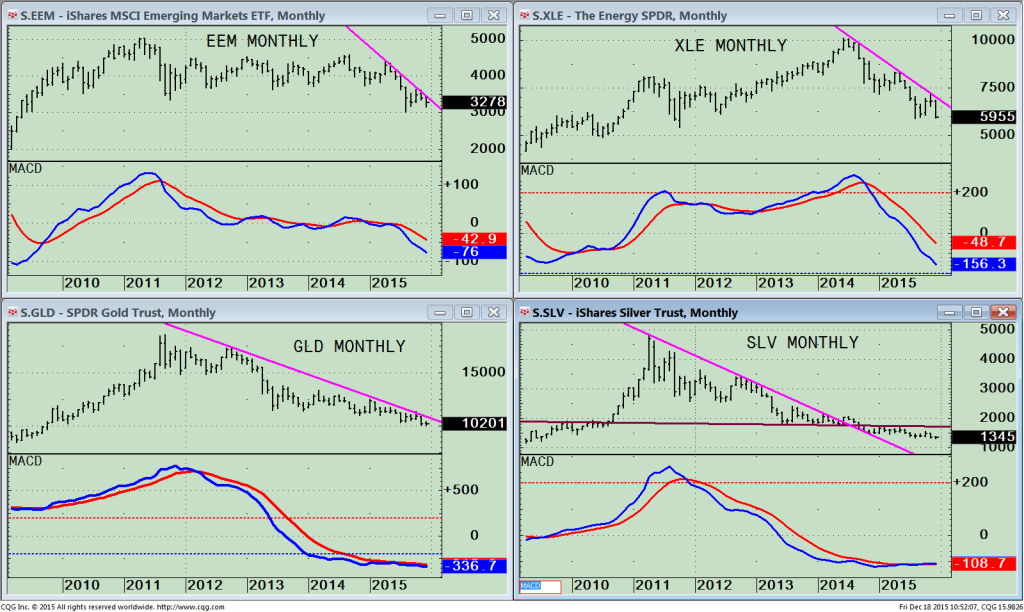
All the lower portions of the charts above use one of my favorite technical momentum indicators, MACD, that was developed by our founder of Signalert Asset Management, Gerald Appel.
Top Left Chart- EEM Monthly:
The iShares MSCI Emerging Markets ETF (EEM) is used by an investors for international exposure to large and mid-cap emerging market stocks. EEM has been out of favor, unable to surpass its peak from May of 2011. There were some rally attempts in 2012 – 2014 but without any follow through to the upside after a peak in September 2014. In general, international investing has not been profitable compared to the U.S. market. Trades on the long side are still high risk until the down trend is penetrated. As of 12/22/15 EEM is trading at 32.45, well above the low in August 2015. Better times could lie ahead in EEM when and if there is a break above 35.00, turning the trend favorable.
Trading on the long side, it will be easier to make money when the long term trend is up instead of down. If there is some weakness after the downtrend is broken and EEM pulls back, an ideal buying opportunity would develop. MACD is still pointing down. No bottom has formed, so patience is still advised. The good news is MACD has now fallen below 0 and is in oversold condition from which significant rallies develop. Later in the year a good buying opportunity could develop. For now, more backing and filling needs to take place before it’s a safe long time buy.
Top Right Chart- XLE, Monthly: The Energy Select Sector Index includes companies in oil, gas & and energy equipment & services. The top holdings in the XLE are Exxon Mobil (XOM), 18.67% Chevron Corporation (CVX) 14.73% Schlumberger NV (SLB) 7.71% totaling 41.10%. It’s a good idea to monitor these stocks to get an idea of the movement of the index. Good or bad news in these stocks will greatly impact the XLE performance.
A downtrend remains in effect but will be broken when XLE breaks 68.00. XLE is trading at 60.63, losing 40.3% since its peak in June 2014, and has fallen 9% so far this month despite being off of its lows. The weekly chart (not shown) has formed a positive divergence suggesting most of the damage in the energy area is likely to have occurred already. MACD is at it’s the lowest level since 2009. MACD is still pointing down, very oversold, and due for a bounce. Given the position of the daily and weekly charts, if the recent lows hold a trading opportunity is likely. There is no safe bottom that has been formed yet so expect more volatility in 2016. Later in the year a safer buying opportunity could develop.
Bottom Left Chart-GLD, Monthly: SPDR Gold Shares ETF (GLD) tracks the price performance of the gold bullion. Gold is at its lowest level since October 2009 and is down almost 10% this year. GLD remains in a downtrend, out of favor since 2011 (Pink Line). MACD has been oversold since June 2013. Normally higher interest rates are negative for gold because it lowers the chances of inflation. If there is a change in perception of inflation GLD could begin to attract money from investors. It’s still too early to say when gold will turn however when it does it could be fast, furious and very profitable.
SLV Monthly: The iShares Silver Trust (ETF) SLV, tracks silver bullion, peaked in April 2011 at 48.35 now trading at 13.59 down 71.9%. SLV is best for aggressive traders, not for conservative investors, because it is extremely volatile. Silver has many industrial uses, benefits from an improving economy and investors sometimes move to SLV as a hedge for safety against economic uncertainty. In the some of the past financial disasters precious metals have been a profitable area to be invested.
The down trendline was violated but no rally has developed. Sideways action in MACD for long periods of time is setting up an environment for a have a large move forthcoming. More patience is required now, however there is a good chance that a tradable rally will occur at some point in 2016.
In Sum:
To no surprise the Fed raised short term rate in December, however talk that the next hike could be in March spooked the market and the S&P 500 (SPY) declined instead of taking out resistance near the highs. The stock market appears to be making another rally attempt as I am writing this article. The jury is out whether the advance could broaden and entice more investors to buy more stocks and fuel the rally higher. Some sectors have been out of favor and represent long term buying opportunities in 2016. Patience is required, however. There is double digit profit potential as downside momentum diminishes and base building occurs before money flow changes hands into out of favor sectors ETFs
EEM, XLE, GLD, and SLV.
It’s been my pleasure sharing my market interpretations with you.
Wishing you and your family a happy holiday season and prosperous healthy New Year. Thank you!
Warmest,
Bonnie
Email: bgortler@signalert.com; phone: 1-516-829-6444 or my personal e mail Bonnie@BonnieGortler.com
*******Article in Systems and Forecasts December 24, 2015


Create more wealth in your life
with these simple strategies.
As an added bonus you will also
receive BG’s Updates and Ezine

Discover how to quickly create more well-being in your life with these simple strategies.
As an added bonus you will also
receive BG’s Updates and Ezine

As an added bonus you will receive BG’s Updates and Ezine

All work listed on BonnieGortler.com is licensed under a Creative Commons Attribution - Noncommercial - No Derivative Works 3.0 Unported License.
