

5 Investing Strategies to Save Money and Grow Wealth
04/11/2024
The Fed’s action in December of increasing rates for the first time since June of 2006 added to an already challenging year for stocks in 2015.
The last few days of 2015 disappointed investors. After the stock market started to show some encouraging technical signs, a year-end rally did not materialize. Buyers quickly turned into sellers after major market indices failed to get through overhead resistance, the same pattern that had occurred numerous times during the year.
The Nasdaq Composite finished positive for the year gaining 5.7%, mostly from a few stocks; Amazon (AMZN), Microsoft, (MSFT) Google, (GOOGL) Facebook (FB), and Netflix (NFLX). The S&P 500 index didn’t fare as well, finishing down for the year -0.7% (excluding dividends).
In case you were wondering why it was so difficult to make money in 2015 I will share some research by Glenn Gortler, Director of Research at Signalert. Out of approximately 4100 stocks tracked in our database:
• 57% of stocks were down for the year.
• 44% of stocks were down more than 10% for the year, and
• 32% of stocks were down more than 20%.
Even though some of the major averages showed small losses, only a few stocks led the indexes higher. If this trend continues, it could be even more of a problem going forward.
In my experience, during the first week of January crazy things happen. Large swings up and down occur frequently, and this year is starting off no differently. The first trading session of the New Year started poorly, after China’s Shanghai Composite lost 7%, halting trading overnight. The Dow Jones Industrial Average followed China’s lead, down more than 250 points at the opening bell, falling over 400 points intraday, before recovering some of their losses.
As I am writing this article (on January 7th) the market is down for the fourth day in a row, with double digit losses intraday.
My favorite sectors to watch for the direction of the market are not acting well. Technology (QQQ) Biotechnology (XBI), Semiconductor (SMH), Transportation (IYT), Finance (XLF) and Small Caps (IWM) all remain under selling pressure, and are not showing any strength yet, indicating that the decline is not coming to an end. Investors have moved away from high risk sectors.
On a positive note, research taken back to 1950 (by Joon Choi, Senior Portfolio Manager) shows if the S&P 500 is down more than 1% but less than 2% on the first day of January, the rest of the month is up 1.6% on average. Another hopeful sign is that momentum oscillators on some averages are no longer extended short term, and stocks are displaying potential positive divergences if they could turn up from here. Many stocks are down more than 20% from their peaks, already creating favorable buying opportunities when the market quiets down and selling pressure subsides. Time will tell. It remains to be seen if the market can hold on and turn up from here.
What Are the Charts Saying?
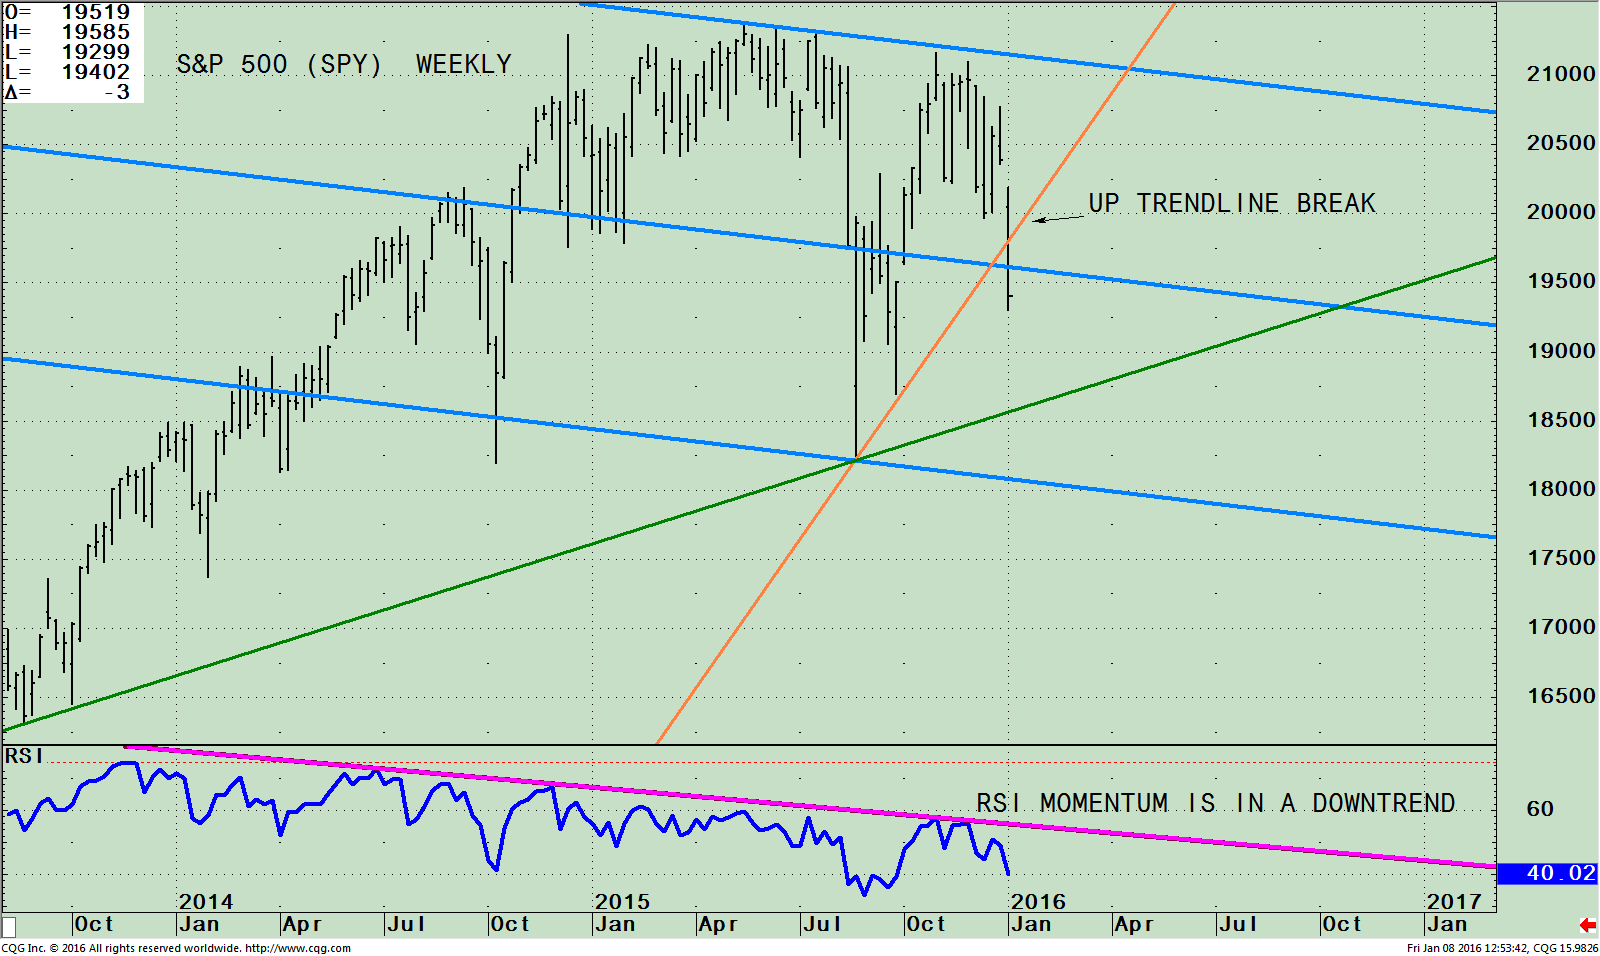
The SPDR S&P 500 (SPY) Weekly ETF With Channel (Top) and RSI14 (Bottom)
The top chart is the SPDR S&P 500 (SPY) ETF which is comprised of 500 stocks of the largest companies in the U.S. listed on national stock exchanges, including over 25 different industry groups.
As of 01/05/16 its top 4 holdings in the S&P 500 are Apple Inc. (AAPL) 3.24%, Microsoft Corporation (MSFT) 2.49%, Exxon Mobil Corporation (XOM), 1.92% and General Electric (GE) 1.64%.
The SPY was near its top of its channel only 6 weeks ago. Each time the S&P 500 rallied, it was unable to break through resistance between 211.50 and 214.00. Failing to get through resistance, the S&P 500 (SPY) pulled back towards its up trendline from July of 2015 (orange line). The trendline was holding, but with today’s action (on 01/07/16) now it has been violated, and that’s not a good sign. The intermediate trend has changed to down. Also, the channel (the blue line), was penetrated at 195.00 and will act as short term resistance. The downside projection is towards the old lows, the bottom of the channel, at 180.00 (lower blue line).
The bottom half of the chart shows the Relative Strength Index, a measure of momentum developed by Welles Wilder. RSI is based on the ratio of upward price changes to downward price changes. In this case over the last 14 weeks RSI looked like it was going to rise and break through the down trend (pink line). This would have been a sign indicating that the SPY was gaining momentum, however with the decline it has turned down, signifying the S&P 500 (SPY) is losing momentum and potential lower prices lie ahead. The downtrend would have to be broken (pink line) for the bulls to regain control and the trend change from down to up.
The Big Question on all of our minds is: Will the decline continue, or will the market turn up from here? Positive Signs That Could Indicate the End of the Decline:
1. Overseas markets start to rise. Keep an eye on Emerging Markets (EEM), China (FXI) and Europe (IEV) as benchmarks.
2. The Value Line Geometric Composite, an unweighted average of roughly 1700 U.S. stocks gains strength showing more broad participation than only a few stocks rising.
3. Firming action in Biotechnology (XBI) and the Financial Sector (XLF, KRE)
4. Apple starts to rise again (APPL).
5. High Yield Bonds stabilize. Use HYG or JNK as a benchmark.
6. Less intraday volatility. Watch to see if VIX moves lower and can get below 18.00.
7. Oil stabilizes and stops falling. Watch oil (USO) and the energy sector (XLE)
8. Small caps (IWM) stabilize, turn up and then gain in relative strength compared to the S&P500 (SPY).
9. S&P 500 (SPY) moves above 195.00 and stays above.
Watch the last hour of trading if the market rallies or falls. If the market indices close near their highs of the day, it’s a good sign that this decline is short lived and better times are ahead. If the last hour of trading moves lower and prices settle near the lows of the day, then this decline could continue for a longer duration.
Summing Up:
2016 has started with a bang: an onslaught of selling pressure in both U.S. and global stocks that is still taking place as of this writing. The first month of January has historically had many roller-coaster rides. This year is no different. The tape is not acting well, to say the least, giving me the feeling that this decline could be more serious. The S&P 500 (SPY) weekly chart broke below support at 195.00, changing the intermediate trend from up to down. Daily volatility is increasing, ]not a good sign. The average daily movement in the S&P 500 (SPY) the past 25 days is now over 1% and rising. It looks like more selling to come. There is plenty of room to the downside towards the old lows, that coincides wth the bottom of the channel at 180.00 on the S&P 500 (SPY). Bottom fishing now without the market stabilizing could be dangerous. Be aware, there is a possibility the major trend has changed and a bear market has started.
If you have questions or comments on this article, please feel free to contact me at bgortler@signalert.com; phone: 1-516-829-6444.
Bonnie Gortler, Senior Portfolio Manager
*******Article in Systems and Forecasts January 8, 2015


Create more wealth in your life
with these simple strategies.
As an added bonus you will also
receive BG’s Updates and Ezine

Discover how to quickly create more well-being in your life with these simple strategies.
As an added bonus you will also
receive BG’s Updates and Ezine

As an added bonus you will receive BG’s Updates and Ezine

All work listed on BonnieGortler.com is licensed under a Creative Commons Attribution - Noncommercial - No Derivative Works 3.0 Unported License.
