

Bonnie’s Market Update 4/12/24
04/14/2024
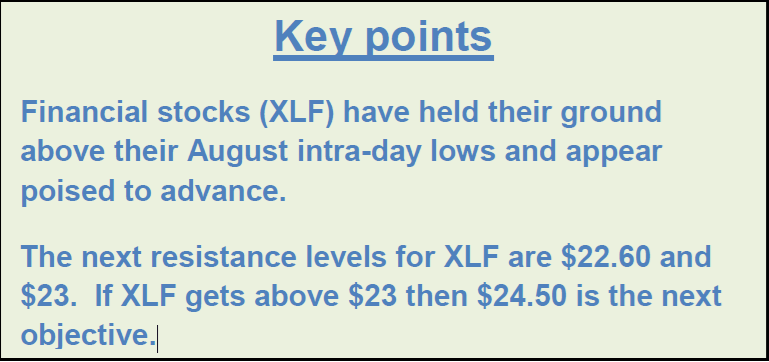 U.S. equities started the month of February poorly XLF Summary but the major averages gained back most of their early losses by the end of the month. As oil prices Financial stocks (XLF) have held their ground fell, stocks went lower in tandem leaving stocks above their August intra-day lows and appear falling over 20%; defensive sectors such as Utilities (XLU), and Consumer Staples (XLP) were more stable. Higher risk sectors such as Materials (XLB), and Industrials (XLI), fared better than Biotechnology (XBI), and technology stocks lagged.
When oil stopped its slide and moved higher, investors were inspired. The temptation to investors was high, stocks were at bargain prices and investors stepped in to buy. The past two weeks U.S. equities rallied sharply off their February 11th lows. Many of the out favor stocks were cheap after being beaten up, falling below their support areas. The market tape has improved noticeably since, especially an improvement in market breadth. Mid-caps have come to life,small-caps are acting better, and banks stocks have rebounded after being crushed. Volatility as measured by VIX is lower, now below 20, and prices of major averages are near or above their 50-day moving averages, all bullish signs. The market is now short term overbought, and trading near overhead resistance above. Investors have been cautious during these last few months as the S&P 500 (SPY) and the Nasdaq have had 3 down months in a row.
They are still trading below the longer term 200-day moving average, a long term negative hanging over the market. Volume has been noticeably low on the rally; money has been flowing away from more aggressive areas as investors have been opting for safety. By no means is the market out of the woods; the bear is resting and in hibernation at the moment, and the market is moving higher even as the long term trend remains negative.
What Are The Charts Saying?
Weekly SPDR Financial Select Sector SPDR (XLF)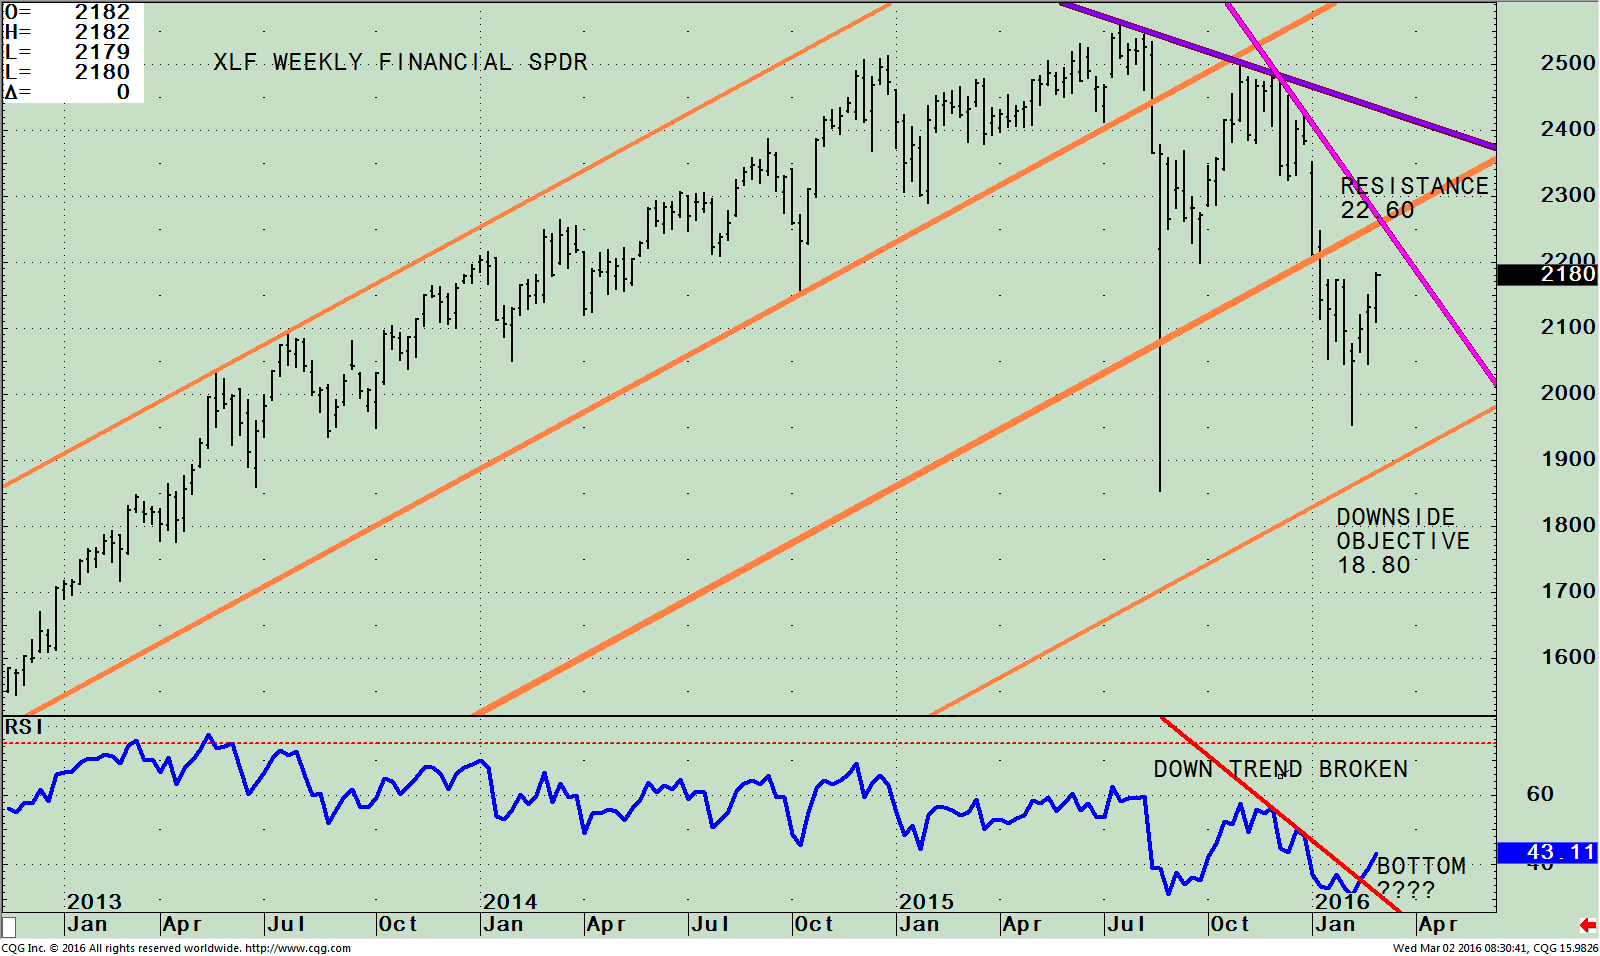
The top portion of the chart above shows the weekly SPDR Financial Select Sector SPDR (XLF) with price and trend channels that are acting as support and resistance areas. XLF looks to mirror the behavior of the financial sector of the S&P 500 Index. The index includes companies from commercial banks, capital markets, diversified financial services, insurance and real estate. The top five largest holdings as of 02/29/2016 are; Berkshire Hathaway (BRK.b) 9.54%, Wells Fargo & Co (WFC) 8.73%, JP Morgan Chase & Co (JPM) 7.86%, Bank of America Corp (BAC) 4.95 and Citigroup (C) 4.39%, representing 35.47% of the ETF.
XLF was one of the weaker sectors of the market, down 8.52% year to date through 03/01/16, and more than 13% below its peak on 07/22/15. Financial sector weakness is not a healthy sign of a bull market. However there is hope. XLF is acting much better recently. All of the top holdings are well off their lows ranging from up 8.9% to 19.4%. The down trend remains in effect from October 2015 (pink line); however XLF appears to have successfully tested its August 2015 lows and is now starting to head up towards resistance at 22.60. In addition, if XLF could break above 23.00, the down trend would be broken. This would be a bullish message for the market going forward. If XLF can break above the resistance then I would expect it to challenge 24.50, which is the longer term down trend line (Purple Line) from the highs of July 2015.
The bottom half of the chart shows the Relative Strength Index, a measure of momentum developed by Welles Wilder. RSI is based on the ratio of upward price changes to downward price changes. RSI has broken the down trend (red line), indicating that XLF is gaining momentum along with a very bullish potential bottom forming that is spread over 23 weeks. The financial sector is also gaining in relative strength to the S&P, (XLF/SPY ratio chart not shown) turning up from a very oversold position on a daily and intermediate basis, good sign suggesting further gains to go. A strong financial sector could be exactly the fuel that the market needs to support the overall stock market to challenge the old highs one more time.
Summing Up:
We are in a bear market rally, but a major bottom in the stock market is not yet in place. The stock market has made an impressive rally over the last few weeks forming an overbought condition for the short term; however the long term trend remains down. For most of this year money was flowing into defensive areas of the market such as Utilities and Consumer Staples as investors were more defensive. In the past three weeks investors’ psychology looks like it’s moving to a higher risk appetite. The financial sector was hit hard, normally not a healthy sign for the market going forward, however a potential bottom appears to be in place with financials stabilizing and beginning to be stronger than the S&P 500. XLF is trading now at 21.95 intraday on 3/2/2016. Watch XLF to see if resistance at 22.60 is broken and then if it can break above 23.00. This would be a bullish message for the market going forward that a rise to the old highs could occur sooner rather than later. The market is not out of the woods; the bear is resting and in hibernation at the moment.
I welcome you to call me with any comments, feedback or questions at 516.829.6444 or email bgortler@signalert.com.
*******Article in Systems and Forecasts March 3, 2016
Disclaimer: This is a hypothetical result and is not meant to represent the actual performance of any particular investment. Future results cannot be guaranteed. Although the information is made with a sincere effort for accuracy, it is not guaranteed either in any form that the above information is a statement of fact, of opinion, or the result of following any of the recommendations made herein. Readers are encouraged to meet with their own advisors to consider the suitability of investments discussed above for their own particular situations and for determination of their own risk levels.


Create more wealth in your life
with these simple strategies.
As an added bonus you will also
receive BG’s Updates and Ezine

Discover how to quickly create more well-being in your life with these simple strategies.
As an added bonus you will also
receive BG’s Updates and Ezine

As an added bonus you will receive BG’s Updates and Ezine

All work listed on BonnieGortler.com is licensed under a Creative Commons Attribution - Noncommercial - No Derivative Works 3.0 Unported License.
