

5 Investing Strategies to Save Money and Grow Wealth
04/11/2024
A new quarter, tax selling season is over, and the start of earning season has begun. What remains in investors’ minds is whether the market will move higher. Supporting the market is that historically April is a profitable month. Investors are rotating in and out of different sectors as the major averages have been consolidating near potential resistance areas the past few weeks. Out of favor sectors such as Materials (XLB), Gold (GLD), Silver (SLV), Emerging Markets (EEM) and Oil (USO) have been attracting money. These sectors all have more room to the upside. If the breakout materializes as I suspect, money will move out of the defensive sectors such as utilities (XLU) and Consumer Staples (XLP) next.
During the advance from the February low, down days have been contained. The major averages such as Dow, S&P 500 and the Nasdaq have worked off their overbought condition. Favorable tape action, low volatility, and strong market breadth all are very encouraging signs that the major market averages will move higher and resistance will be broken to the upside.
The bulls remain in control climbing the wall of worry.
Tape Action Clues To Monitor For Further Gains Ahead:
The financial sector to continue rising. Watch for additional strength in KRE and XLF. The ultimate would be if financials would be stronger than the S&P 500 (SPY). XLF previously paused at resistance at 22.60 (03/3/16 newsletter). As of 04/13/16, XLF is 22.93, looking like it’s ready to bust through resistance and test its next objective at 24.50.
The Nasdaq 100 (QQQ) is close to resistance at 111.00. Further gains lie ahead if penetrated. A good sign will be if the QQQ will lead the advance higher, and be stronger than the S&P 500 (SPY). Watch the QQQ/SPY ratio.
Crude oil and the energy sector stocks are stable. Watch the United States Oil Fund (USO) and the energy sector (XLE). The XLE is showing strength lately after recently breaking the weekly downtrend from September 2014. USO closed on 04/13/16 at 10.53. Support is at 9.00 and resistance at 10.80 followed by 11.42.
The Transportation Average (IYT) takes out 145.85, its 03/2/16 peak, confirming the Dow Jones Industrials high (DIA) on 04/13/16.
Continued strength in midcaps. (MDY) Short-term support is 259.00. Resistance is at 269.00. If the MDY breaks through resistance, upside projections to 280.00 could be a reality. The MDY/SPY weekly ratio broke the down trend confirming an increase in upside momentum. (See my article in the April 1st Systems and Forecasts newsletter).
New 52 week lows on the New York Stock Exchange Index remain low, presently at 2. Risk is minimal as long as the new 52-week lows stay below 25.
Overseas markets rise further supporting the U.S. Keep an eye on Emerging Markets (EEM), China (FXI) and Europe (IEV) as benchmarks. All three ETFs made higher highs on 04/13/16 than the previous high on 03/30/16.
Volume has been unconvincing, remaining light. An increase in trading volume on the New York Stock Exchange would fuel gains.
High yield bonds keep rising. Use ETFs HYG or JNK as a benchmark.
The Value Line Geometric Composite, an unweighted average of roughly 1700 U.S. stocks closed higher than 03/31/16. More stocks are participating in the advance as the rally is gaining steam.
Small caps are generating investors’ attention showing signs of leadership compared to the S&P 500 (SPY). This is bullish! Keep an eye out for more strength in the small caps (IWM).
Watch the last hour of trading. If the major indices close near the highs of their daily range consistently this would be bullish.
What Are The Charts Saying?
The SPDR S&P 500 (SPY) Weekly With Channel (Top) and 12-26 Week MACD (Bottom)
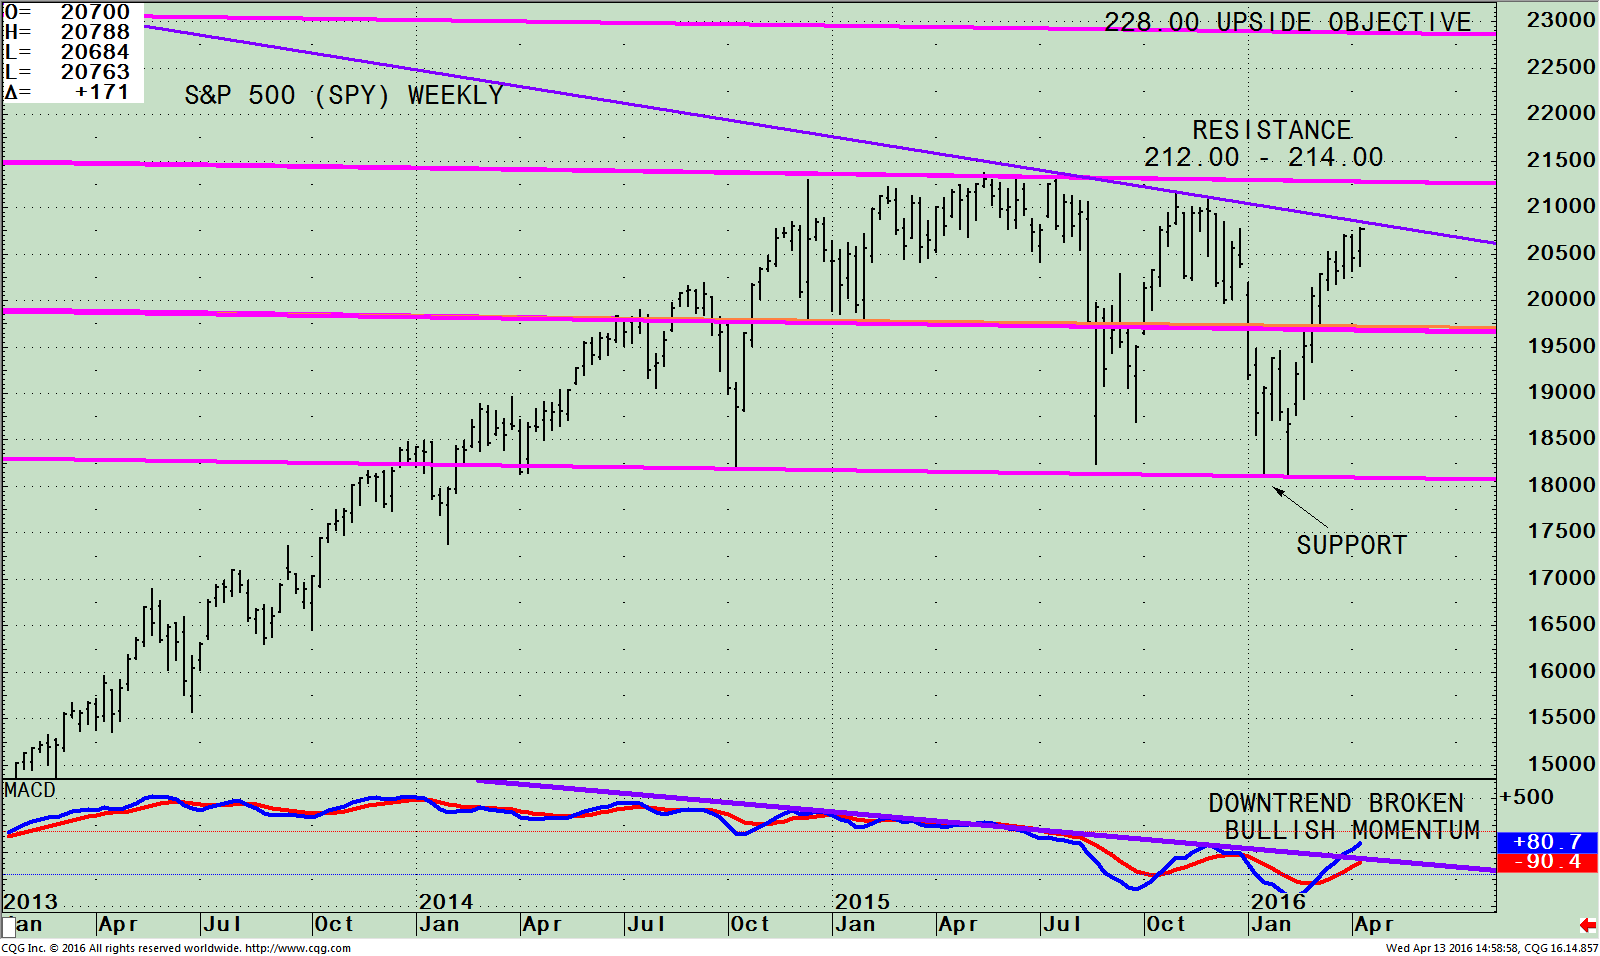
The top chart is the weekly SPDR S&P 500 (SPY) ETF that is comprised of 500 stocks of the largest companies in the U.S. As of 04/12/16 its top 4 holdings in the S&P 500 were Apple Inc. (AAPL) 3.41%, Microsoft Corporation (MSFT) 2.40%, Exxon Mobil
Corporation (XOM), 1.95% and Johnson & Johnson (JNJ) 1.68%.
In the 03/17/16 issue I raised the question of whether a breakout or top was forming. The S&P moved in a tight range the past month, working off its overbought condition staying within the trading channel (pink lines). The S&P 500 (SPY) broke
above 204.00, a shorter term resistance area getting the bulls interested again. The SPY appears ready to break the down trendline from July 2015 and challenge resistance at 212.00 – 214.00 now. If resistance is penetrated, 228.00 is an upside objective.
The bottom half of the chart shows MACD, a measure of momentum, on a buy. Good news, the downtrend from May 2015 (purple line) has been broken, a bullish sign suggesting the SPY will get through overhead resistance sooner rather than later.
Summing Up:
Sideways action appears to have ended. The stock market is gaining steam. A potential breakout to the upside is developing. Investors were excited when the S&P 500 (SPY) rose above 204.00. Our trading models remain in the most favorable condition. Watch for further clues by the market tape to give further confirmation that the S&P 500 (SPY) breaks out. A move above 208.00 followed by 212.00 and 214.00 will give an upside objective of 228.00. In case something
unforeseen happens, a break below 200.00 on the S&P 500 (SPY) would surprise me and change my optimistic bullish outlook for higher prices ahead.
I welcome you to call me with any comments, feedback or questions at 516.829.6444 or email bgortler@signalert.com.
*******Article in Systems and Forecasts April 14, 2016
For the audio version listen here:


Create more wealth in your life
with these simple strategies.
As an added bonus you will also
receive BG’s Updates and Ezine

Discover how to quickly create more well-being in your life with these simple strategies.
As an added bonus you will also
receive BG’s Updates and Ezine

As an added bonus you will receive BG’s Updates and Ezine

All work listed on BonnieGortler.com is licensed under a Creative Commons Attribution - Noncommercial - No Derivative Works 3.0 Unported License.
