

5 Investing Strategies to Save Money and Grow Wealth
04/11/2024
 The major averages took a breather to start the month of May, after stocks were gaining momentum and the major averages seemed ready for a breakout to the upside. Instead of making new highs, breaking resistance above, the major averages moved lower as investors turned somewhat cautious and took profits. The short term weakness early in the month down ticked our models from the most favorable condition, yet they remain neutral-bullish, most likely at least a few weeks away from generating sells. The market could be a vulnerable to further decline if the short term support levels are broken to the downside. The decline would most likely be contained because market breadth has been solid, more of a sign of a healthy market than a sign of an immediate market top.
Soon after I wrote the article “small caps gaining momentum; enjoy the ride” in the 04/28/16 newsletter, the Russell 2000 (IWM) penetrated support at 112.00 after peaking at 115.05 on 04/27/16. Many market indexes are near their highs trading above major support, however they were unable to break through resistance. Shorter
term investors have begun to take profits in sectors that have rallied sharply from their lows. Out of favor sectors from last year such as oil (USO), gold (GLD and XME), silver (SLV), and emerging markets (EEM) have been strong this year.
The weakness in high yield bonds lately is disturbing, especially since historically May and June are not the best performing months of the year for high yields. It’s more favorable when they are rising, leading the market. More weakness in high yield bonds, oil, emerging markets, Nasdaq, financials and negative breadth would be warning signs of a pending decline.
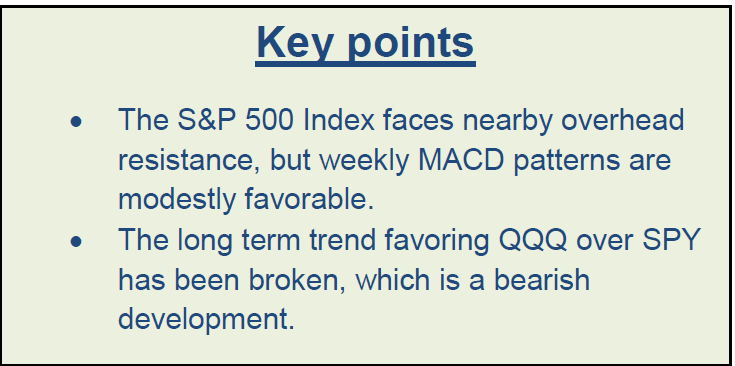
What Are The Charts Saying?
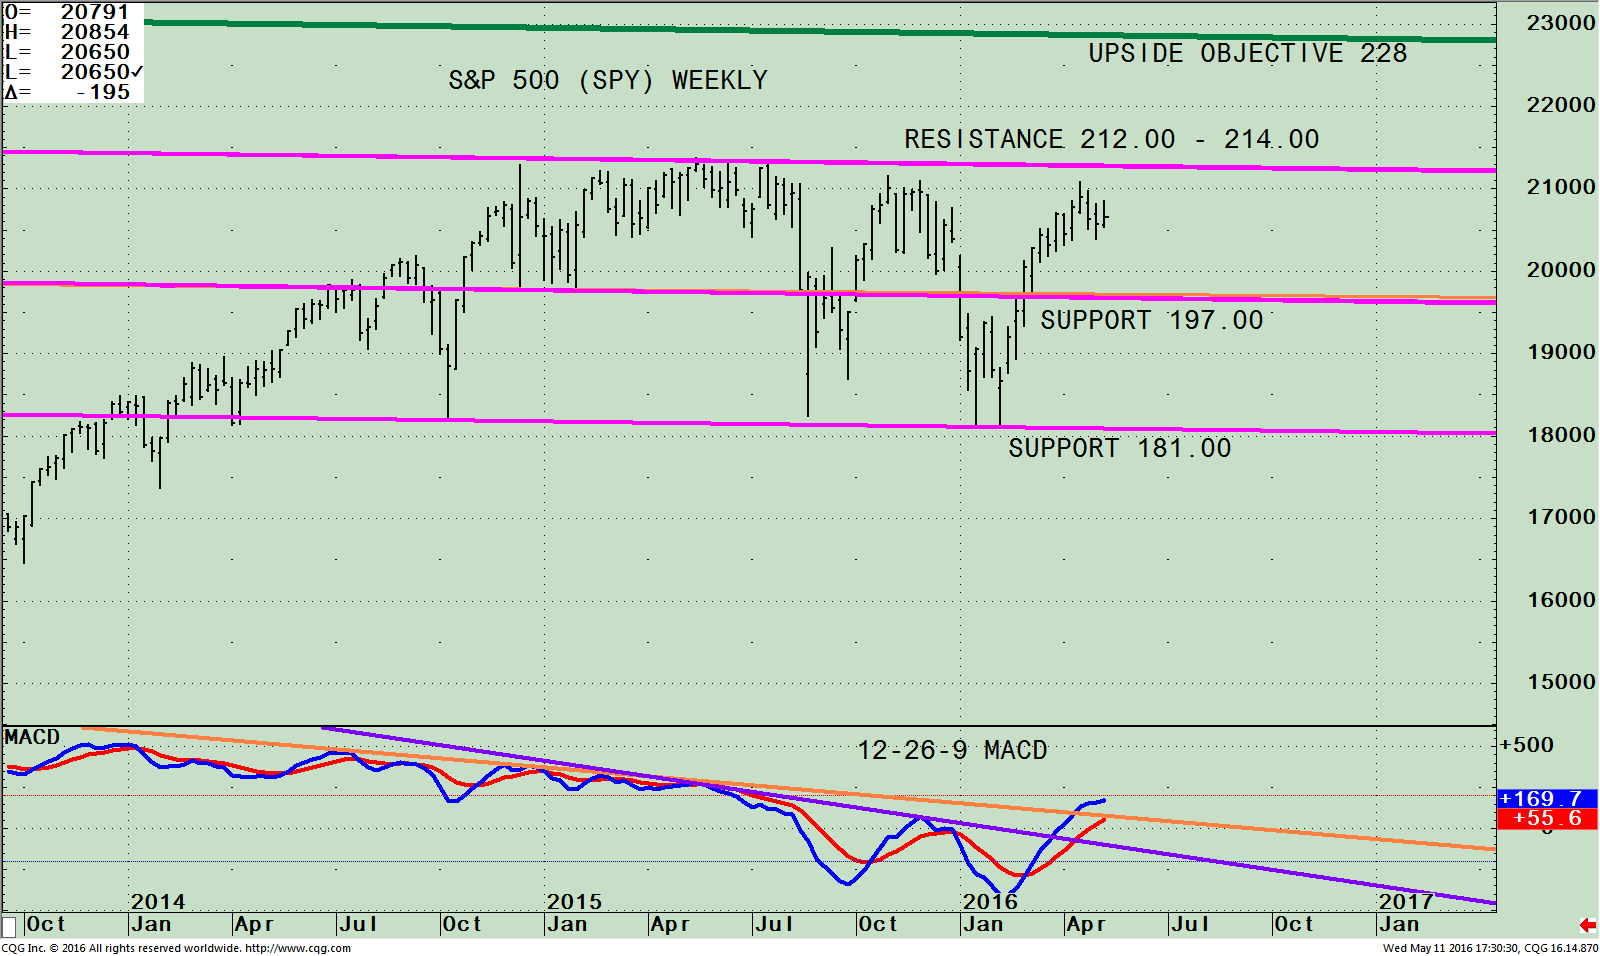
The SPDR S&P 500 (SPY) Weekly With Channel (Top) and 12-26 Week MACD (Bottom)
The top chart is the weekly SPDR S&P 500 (SPY) ETF that is comprised of 500 stocks of the largest companies in the U.S. As of 05/10/16 its top 4 holdings in the S&P 500 were Apple Inc. (AAPL) 2.86%, Microsoft Corporation (MSFT) 2.20%, Exxon Mobil Corporation (XOM), 2.04% and Johnson & Johnson (JNJ) 1.74%. Apple, the number one holding has been out of favor by investors. The technology area as a whole continues to lose momentum, losing relative strength vs the S&P 500 (SPY). Technology has been especially weak and as of late, no longer a leader for the market (see chart below). It would help if the top holdings in the S&P 500 index were strong.
The S&P 500 (SPY) has been within the trading channel (pink lines) since last year. SPY looked like it would finally break through resistance but instead turned lower. SPY has been in a tighter range between 204.00 and 209.00 since April. If SPY closes above 210 for two days, this could be a sign a bullish outcome will materialize, where stops would get hit and the SPY would get through the resistance area above at 212.00 – 214.00. If resistance is penetrated, 228.00 is the upside objective. A break below 204.00, a previous resistance level, is now acting as short term support. The next level is at 197.00, followed by 181.00.
The bottom half of the chart shows MACD, (a measure of momentum), on a buy, at its highest level since July 2015. Both the longer and shorter term downtrend has been broken (purple and orange line) suggesting the SPY could challenge overhead resistance and possibly make it through. This is favorable for the S&P 500 (SPY); however MACD is no longer oversold, so any rally could be short lived, and a short term pullback might happen first setting up a potential double bottom formation later in the year. The S&P 500 (SPY) improvement on a weekly basis is positive. However, its strength is a double edged sword. Historically the stock market is more
profitable when the Nasdaq is stronger than the S&P 500.
Monthly QQQ (Nasdaq 100 Index) / (SPY) S&P 500 Index Ratio
The long term bull market up trendline has been broken!
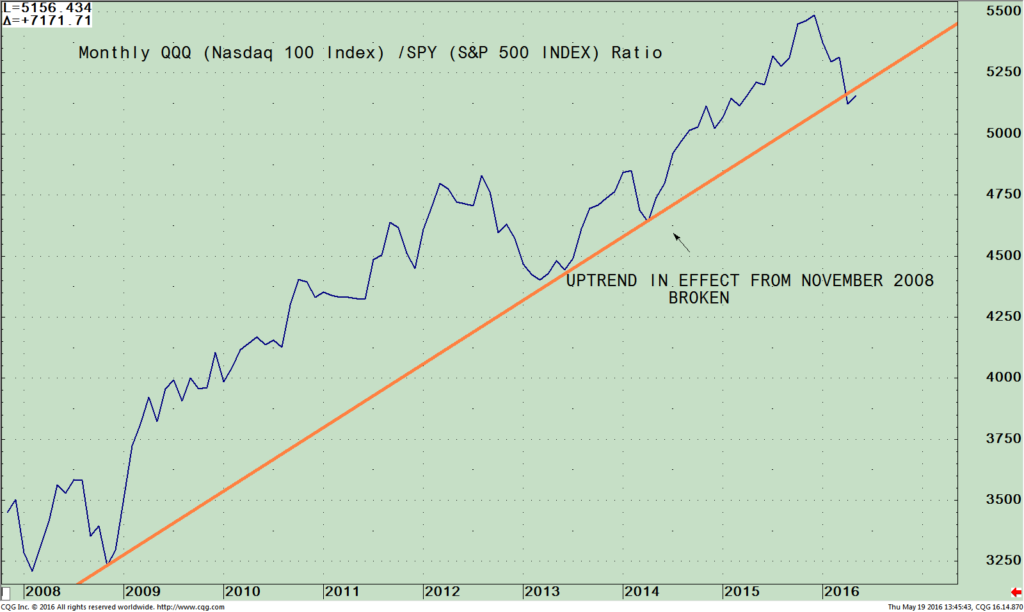
The above chart is the monthly Nasdaq 100 /S&P 500 ratio (QQQ/SPY). A rising line means the QQQ is stronger, and if falling, the S&P 500 is stronger. As of 2/17/16 the ratio turned down giving a warning of deteriorating momentum in the technology sector (QQQ), however, the uptrend trend from 2008 was intact. Now the uptrend of the (QQQ/SPY) ratio from November 2008 (orange line) has been broken. This is negative for the overall market. It’s much easier to make money on the long side when the short, intermediate, and long term trends are favorable.
Summing Up
Resistance remains in the SPY between 212.00 and 214.00. The relative strength ratio of the QQQ/SPY shows deteriorating momentum saying the S&P 500 (SPY) is stronger than the Nasdaq, not a positive development for the broad market. Keep an eye out if the S&P 500 breaks below 204.00, a previous resistance level, now acting as short term support. If penetrated, 197.00 is possible. I would be more optimistic if the S&P 500 (SPY) would break through resistance, and if the Nasdaq was leading in relative strength. That is not case now as the long term bull market trend line from the start of the bull market has been broken and an unfavorable seasonal period is ahead. Proceed with caution, new buying is not recommended, a better buying opportunity lies ahead.
I would love to hear from you. Please feel free to share your thoughts, comments or ask any question you might have.
Please call me at 1-516-829-6444 or email at bgortler@signalert.com.
*******Article in Systems and Forecasts May 12, 2016

Discover the right wealth building attitude…
Download a
Free chapter
of my book
Journey To Wealth


Create more wealth in your life
with these simple strategies.
As an added bonus you will also
receive BG’s Updates and Ezine

Discover how to quickly create more well-being in your life with these simple strategies.
As an added bonus you will also
receive BG’s Updates and Ezine

As an added bonus you will receive BG’s Updates and Ezine

All work listed on BonnieGortler.com is licensed under a Creative Commons Attribution - Noncommercial - No Derivative Works 3.0 Unported License.
