

Bonnie’s Market Update 4/12/24
04/14/2024
June was a very volatile month for equities, due to the 06/23/16 U.K. referendum vote to leave the European Union (EU). Investors were caught off guard, very surprised by the results and opted to sell equities. The stock market doesn’t like uncertainty. Stocks fell sharply, VIX, (an index that measures fear) rose sharply from 12.72 to 27.72, in a span of a few days. Investors purchased bonds for safety causing the 10-year U.S. Treasury yield to fall to record lows of 1.3%.
Fortunately, the decline was short lived after the S&P 500 (SPY) fell 5.4%, in two days. Instead of the market falling further, the bulls took control, equities stabilized and fear subsided. By month end U.S. and global equities had made significant comebacks, rebounding sharply back to levels near or higher where they were before the news.
Our models are overall bullish. With support levels holding on the major averages during the recent decline, I am optimistic (although a bit worried) that prices will work their way higher and ultimately break out to the upside.
The SPDR S&P 500 (SPY) Weekly With Channel (Top) and 14 Week RSI (Bottom)
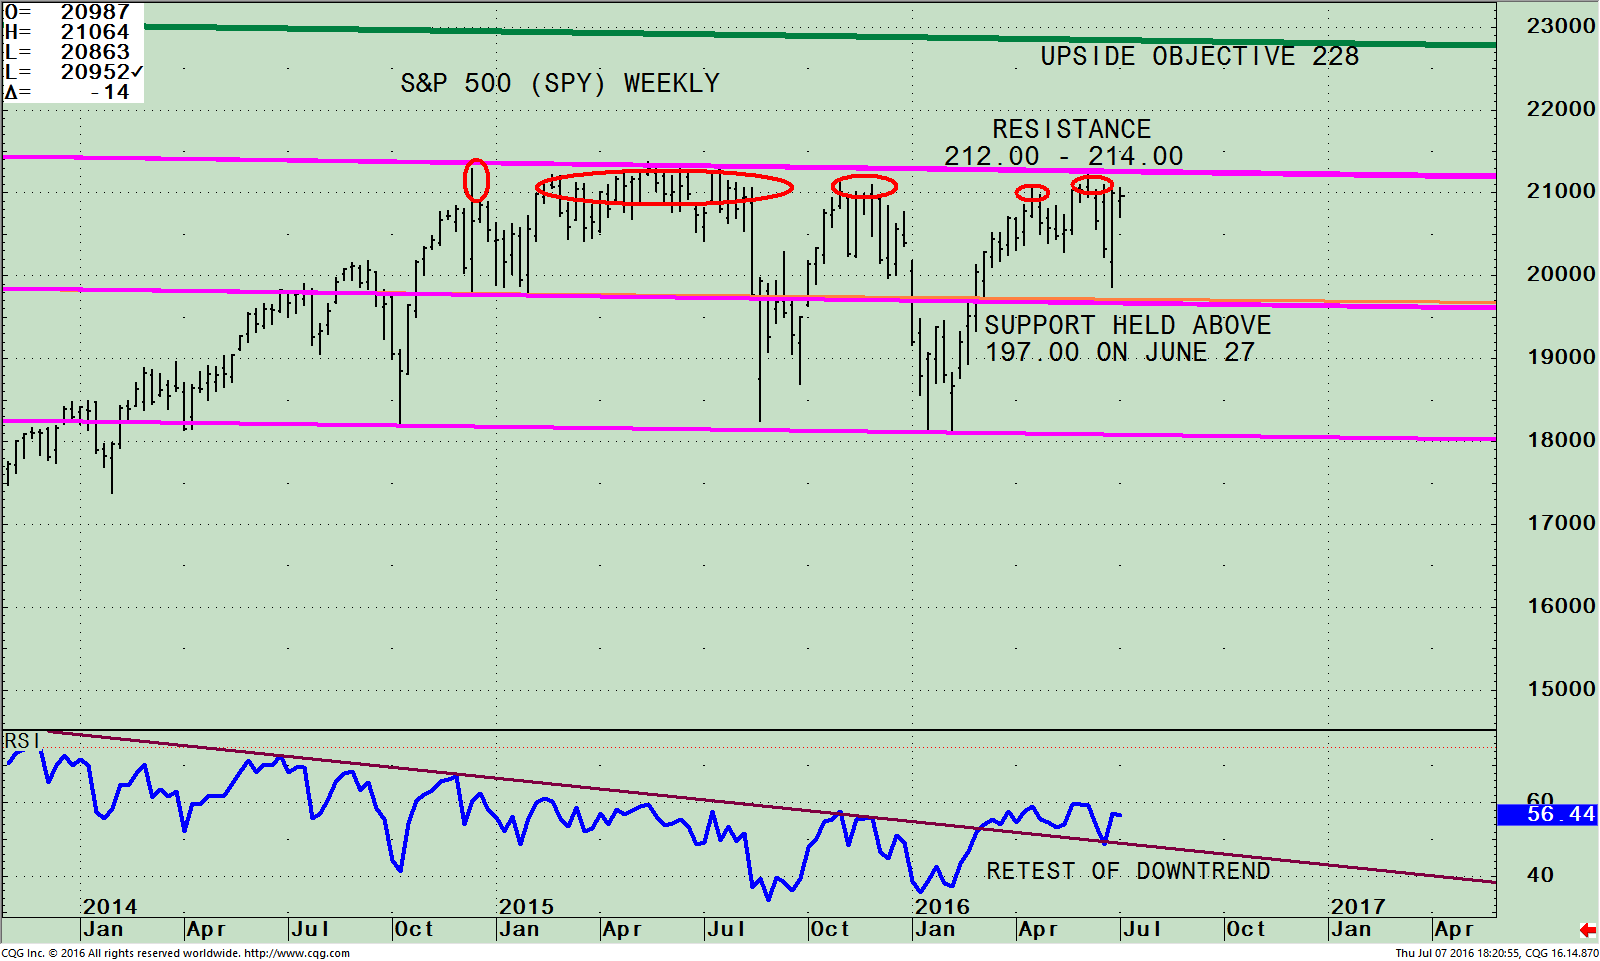
The chart above is the weekly SPDR S&P 500 (SPY) ETF that is comprised of 500 stocks of the largest companies in the U.S. As of 07/06/16 its top 4 holdings in the S&P 500 were Apple Inc. (AAPL) 2.85%, Microsoft Corporation (MSFT) 2.21%, Exxon Mobil Corporation (XOM), 2.12% and Johnson & Johnson (JNJ) 1.85%. Investing in the S&P 500 gives you a broad representation of the overall large-cap U.S. stock market.
The S&P 500 (SPY) remains within the trading channel (pink lines) since December 2014. The S&P
500 (SPY) is once again challenging its highs after pulling back towards the middle channel and holding support at 197.00, with a low of 198.65 on 06/27/16. Notice how each time the S&P 500 (SPY) challenged the top of the channel a pullback occurred. Even with the uncertainty in the markets, I’m hopeful this could be the time that the S&P 500 (SPY) finally breaks through the resistance above instead of falling and testing the middle channel.
If resistance is penetrated between 212.00 – 214.00 and stays above it for two days on a closing basis then SPY could be ready to start another swing to the upside towards 228.00. On the other hand, if SPY breaks below 197.00 this would not be a good sign. Following a breakdown to below 197 I would expect SPY to move towards the lower channel at 181.00 quickly (lower pink line).
The bottom half of the chart shows the Relative Strength Index, a measure of momentum developed by Welles Wilder. RSI is based on the ratio of upward price changes to downward price changes.
RSI broke the downtrend which was bullish. Now RSI has retraced back to the level where the RSI trendline broke out from and needs to hold. A turn up in RSI would be bullish, yet further weakness in the S&P would turn RSI down and show declining momentum which would not be positive.
With all of the uncertainly in the world, tape action is very important to be monitored for market direction.
Here is what I am watching.
Catalysts to Keep An Eye on For Market Direction:
Monitor overseas markets to see if they stabilize and can work their way higher. Watch Europe (IEV) and Emerging Markets (EEM) ETFs as benchmarks.
Look for the selling to stop in European banks that have fallen sharply. Monitor the iShares MSCI Europe Financials ETF (EUFN).
Monitor the US. Financial Sector to see if it stabilizes and can move higher, (XLF and KRE).
Observe the strength in the Biotechnology sector XBI). A rise would indicate investors are willing to
take on more risk.
Watch to see if the technology sector becomes a leader over the S&P 500. Watch the Nasdaq 100
(QQQ) and the Semiconductors HOLDR (SMH). Also keep an eye on Apple, which has been under selling
pressure for months. Now it appears to have successfully tested its recent lows and has improving
chart patterns.
High Yield Bond Mutual Funds remain strong and keep making highs. Use (HYG) or (JNK) as a
benchmark.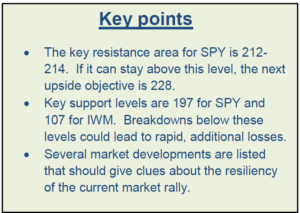
Watch to see the movement in VIX (an index that measures fear) when the market declines. Look if VIXaccelerates quickly or it moves up quietly. If the market falls it would be a bullish sign if VIX moves lower. It’s best if VIX could stay below 20. It is bullish of oil (USO), and the energy sector (XLE), trend higher.
Small caps (IWM) were beginning to outperform the S&P 500 and then stopped. If small caps were to gain in relative strength compared to the S&P 500 (SPY) this would be bullish, also suggesting investors willing to take on more risk. The Russell 2000 (IWM) needs to hold support at 107.00. A break below would be a bearish warning that a pending decline is ahead.
In Sum:
The market had a quick scare and sold off sharply in June but appears to have stabilized and is poised to move higher. The S&P 500 is very close to the upper trading channel again. It would be bullish if the S&P 500 (SPY) stays above 212.00 and 214.00 for two days on a closing basis. If this occurred I believe the S&P could start another swing higher towards the upside objective of 228.00. Some clues that would be positive for stocks would be if European banks, the US financial sector, small caps and technology move higher and lead the way. A break below 197.00 on the S&P 500 (SPY) and 107.00 on The Russell 2000 (IWM) would cause me to rethink my bullish outlook and turn more cautious to lower exposure in equities.
I would love to hear from you. Please feel free to share your thoughts, comments or ask any question
you might have. Please call me at 1-516-829-6444 or email at bgortler@signalert.com.
*******Article in Systems and Forecasts July 8, 2016

Discover the right wealth building attitude…
Download a
Free chapter
of my book
Journey To Wealth
Disclaimer: This is a hypothetical result and is not meant to represent the actual performance of any particular investment. Future results cannot be guaranteed. Although the information is made with a sincere effort for accuracy, it is not guaranteed either in any form that the above information is a statement of fact, of opinion, or the result of following any of the recommendations made herein. Readers are encouraged to meet with their own advisors to consider the suitability of investments discussed above for their own particular situations and for determination of their own risk levels.


Create more wealth in your life
with these simple strategies.
As an added bonus you will also
receive BG’s Updates and Ezine

Discover how to quickly create more well-being in your life with these simple strategies.
As an added bonus you will also
receive BG’s Updates and Ezine

As an added bonus you will receive BG’s Updates and Ezine

All work listed on BonnieGortler.com is licensed under a Creative Commons Attribution - Noncommercial - No Derivative Works 3.0 Unported License.

Thanks Bonnie for a great summary of the recent activity.
The more you lead me through the charts, the more I appreciate their picture.
Thank you Doug for visiting my blog and sharing your comment. I love that you are relating to the charts!
Bonnie