

5 Investing Strategies to Save Money and Grow Wealth
04/11/2024
The stock market has quietly advanced during the first half of August. The daily price movements over the past 25 days in the S&P 500, Russell 2000, and the Nasdaq 100 have been extremely small, ranging from 0.28% – 0.43% as prices have moved higher. As long as this phenomenon continues of low day to day volatility, downside risk will be contained.
Tape action remains encouraging, many major indices have broken through resistance levels that were in place for over a year and have made new all-time highs. Market breadth has supported the advance with The New York Stock Exchange (NYSE) advance-decline line also making a new high. A market top rarely happens at a final price high that is confirmed by the (NYSE) Advance-Decline Line.
The August through October period historically is not an ideal low risk environment to be invested in the stock market. During the third quarter of an election year, like now, the negative bias is not true.
Instead, it’s positive for the market.
Our models continue to suggest favorable market conditions, although not at the level where risk is
at its lowest. There are no blatant warning signs of a potential serious decline ahead; however there are a few small non-confirmations. I would like to see the transportation average confirm the Dow’s recent high and for the Russell 2000 Small-Cap Index to outperform the S&P 500 (SPY) and make a new all-time high.
All in all, the tape remains favorable, the bulls remain in control and I believe the advance will continue.
What Are The Charts Saying?
The SPDR S&P 500 (SPY) Weekly With Channel (Top) and 12-26-9 Week MACD (Bottom)
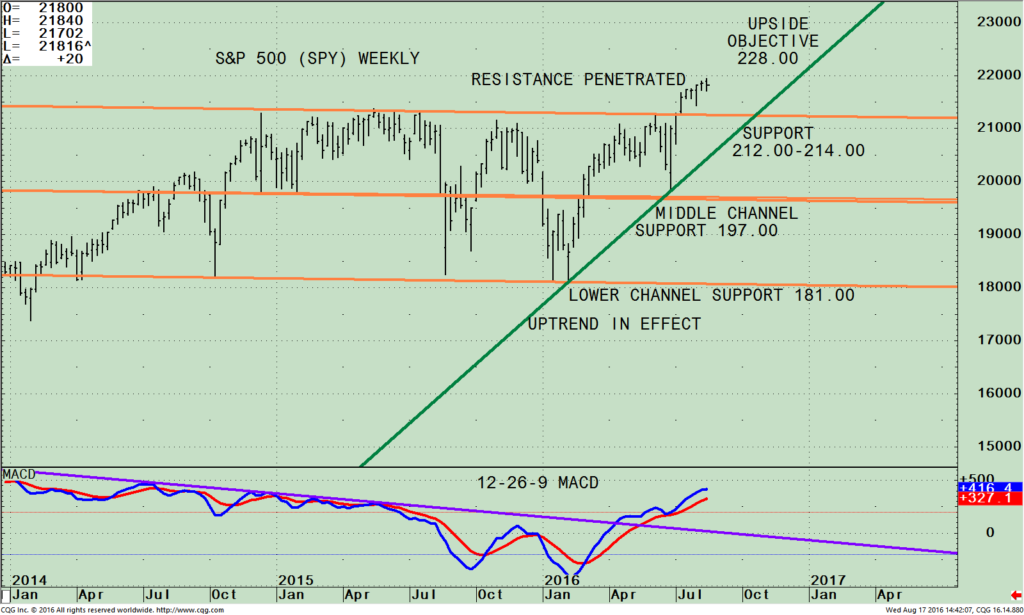
The chart above is the weekly SPDR S&P 500 (SPY) ETF that is comprised of 500 stocks of the largest companies in the U.S. As of 08/16/16 its top 4 holdings in the S&P 500 were Apple Inc. (AAPL) 3.12%, Microsoft Corporation (MSFT) 2.40%, Exxon Mobil Corporation (XOM), 1.92% and Johnson & Johnson (JNJ) 1.79%. Investing in the S&P 500 (SPY) gives you a broad representation of the overall large-cap U.S. stock market.
The S&P 500 (SPY) finally broke out of its trading channel beginning December 2014 after penetrating the 212-214.00 resistance on 07/11/16. Old resistance is now key support if a pullback would arise. It would be bullish if the S&P 500 (SPY) remains above this level, increasing the odds of the SPY reaching the upside target of 228.00, 5% higher. Another point of reference to watch is if the uptrend remains intact from the February lows. The green trendline in the chart shows that this uptrend remains intact. As long as 204.00 is not violated, the intermediate trend is up. Remember the trend is your friend.
On the other hand, if SPY breaks below 212.00 this would be an early warning that the intermediate trend is in process of changing, and risk increasing. If the uptrend is broken, the middle channel at 197.00 would act as the next support level.
The bottom half of the chart shows MACD, a measure of momentum. MACD is on a buy, rising, above 0, and has confirmed the price high made in the S&P 500 (SPY). MACD needs to be monitored to see if and when it turns down.
This would be an advanced warning that momentum is weakening and that a potential change of trend could occur.
MACD is now somewhat extended, but no negative divergences exist and the uptrend remains in effect.
Therefore, no need to worry yet, continue to enjoy the ride.
Summing Up:
The stock market advance quietly continues. Our models remain favorable. Market breadth and price action is positive. The advance decline line has confirmed new highs in the S&P 500 (SPY) suggesting a final top most likely hasn’t been made.
Major market averages have broken through resistance to the upside after many attempts earlier in the year.
The uptrend from the February lows remains in-tact. The trend is our friend.
In the near term, unless the S&P 500 (SPY) closes below 212.00 for two days, the benefit of the doubt goes to the bulls for the S&P 500 (SPY) to continue higher toward the upside objective of 228.00.
I would love to hear from you. Please feel free to share your thoughts, comments or ask any question you might have. Call me at 1-516-829-6444 or send an email to bgortler@signalert.com.
If you like this article, then you will love this! Click here for a free report: Top 10 investing tips to more wealth.
*******Article in Systems and Forecasts August 18, 2016

Discover the right wealth building attitude…
Download a
Free chapter
of my book
Journey To Wealth
Disclaimer: This is a hypothetical result and is not meant to represent the actual performance of any particular investment. Future results cannot be guaranteed. Although the information is made with a sincere effort for accuracy, it is not guaranteed either in any form that the above information is a statement of fact, of opinion, or the result of following any of the recommendations made herein. Readers are encouraged to meet with their own advisors to consider the suitability of investments discussed above for their own particular situations and for determination of their own risk levels.


Create more wealth in your life
with these simple strategies.
As an added bonus you will also
receive BG’s Updates and Ezine

Discover how to quickly create more well-being in your life with these simple strategies.
As an added bonus you will also
receive BG’s Updates and Ezine

As an added bonus you will receive BG’s Updates and Ezine

All work listed on BonnieGortler.com is licensed under a Creative Commons Attribution - Noncommercial - No Derivative Works 3.0 Unported License.
