

5 Investing Strategies to Save Money and Grow Wealth
04/11/2024
For almost 2 months, the market was quiet, moving sideways to higher. The S&P 500 (SPY) daily change was less than 1%, and then September 9th occurred. Investors’ perception changed from bullish to bearish, spooked by news of potential rising rates in September, sooner than expected and the S&P 500 fell 2.45%. It’s been months since heavy selling has occurred. Volatility rose sharply. VIX, (an index that measures fear) increased from an intraday low of 11.65 to a high of 20.51 in two days, a gain of 76%. There was no place to hide.
The next day, stocks reversed quickly to the upside, however the rally couldn’t be sustained. Heavier selling the next day was broad based. Few stocks rose and many fell. The tape showed very poor market breadth readings on heavy volume, including new 52 week highs deteriorating. The trading screen was full of red, emotions rekindled, and a feeling of angst by investors was front and center (including me). Volatility is back. Risk has increased. Market breadth is no longer favorable supporting the market, so stock and sector selection will be more important making money going forward. Our models have moved from positive to neutral and no longer suggest the market is low risk.
For the short term in favor of the bulls, the major averages are only a few percent from their highs. Support levels on the S&P 500, Nasdaq and Russell 2000 have held so far. The unfavorable seasonal period of September, including expiration will soon be behind us. Institutions will begin to focus on the end of quarter window dressing, preparing for rising rates and the presidential elections. Also supporting the market is Apple, (AAPL) the stock investors had shied away from, out of favor since the highs made in April 2015. Apple (AAPL) has clearly broken its weekly downtrend to the upside, now up from 102.53 on 091216 to trading at 114.91 as of this writing. If Apple rises more you can look for the technology sector to continue to be stronger than the S&P 500. In the long run this is a bullish sign for the market.
As of this writing the latest decline looks more like a short-term pullback within an uptrend that could lead to more gains and another test of the highs. I am cautiously bullish watching closely to see if the support levels hold, and if the intermediate up trend remains in-tact I will give the market the benefit of the doubt.
Chart To Watch Now:
The SPDR S&P 500 (SPY) Weekly With Channel (Top) and 12-26-9 Week MACD (Bottom)
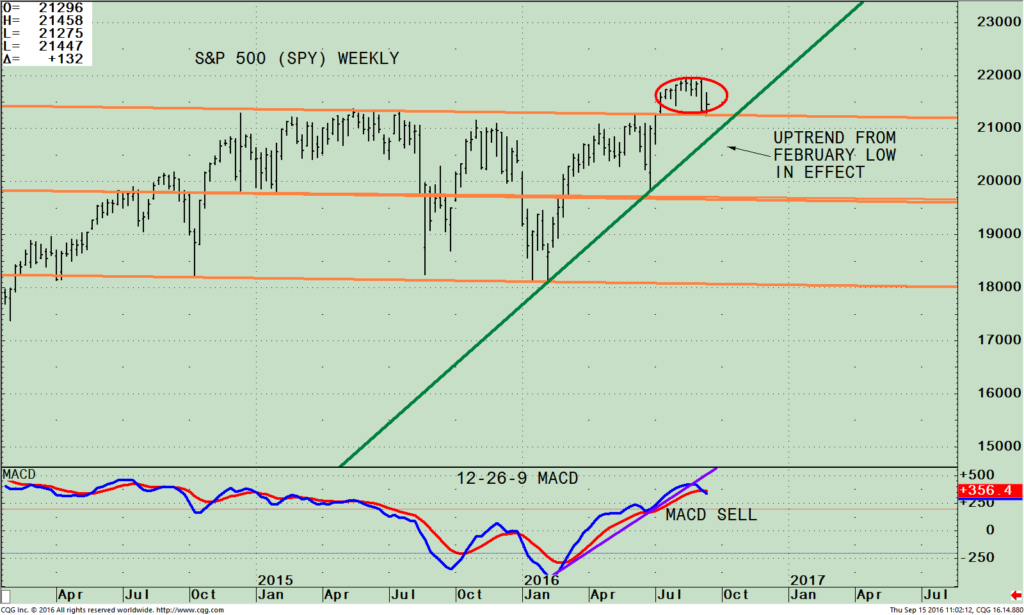
The chart above is the weekly SPDR S&P 500 (SPY) ETF that is comprised of 500 stocks of the largest companies in the U.S. As of 09/14/16 its top 4 holdings in the S&P 500 were Apple Inc. (AAPL) 3.07%, Microsoft Corporation (MSFT) 2.39%, Exxon Mobil Corporation (XOM), 1.93% and Johnson & Johnson (JNJ) 1.74%. Investing in the S&P 500 (SPY) gives you a broad representation of the overall large-cap U.S. stock market.
The top part of the chart shows the S&P 500 (SPY) penetrated its trading channel, getting through resistance at 212-214.00 in July 2016 (red circle). Notice on the recent sell off, the S&P 500 tested the breakout of the channel making a low of 212.50, holding just above 212.00 acting as key support. As long as the S&P 500 (SPY) can hold 212.00 and turns up, this would be considered a successful test of the upside breakout in July. The upside target for the S&P 500 (SPY) remains at 228.00 mentioned in the August 18th newsletter.
On the other hand, if the SPY closes below 212.00 for two days, a warning would be given a further decline is likely. As long as 204.00 on the S&P 500 (SPY) is not violated, the intermediate trend remains intact (the green line) and up. If violated, the decline could accelerate fast and possibly be more than a short term correction. Next support 197.00.
The bottom half of the chart shows MACD, a measure of momentum. MACD is now falling, and has generated a sell. It’s very clear momentum is weakening. It’s a good sign MACD confirmed the breakout and no negative divergence took place. Tops many times take a long time to form and the confirmation makes me believe another leg up could occur before there is a more serious decline. Its positive MACD confirmed the breakout and no negative divergence took place.
Summing Up
There was a short term change in investors’ perception from bullish to bearish that evoked panic selling and caused stock prices to fall sharply with increased volatility. It looks like there has been a successful test of the upside breakout in July. Warning signals are starting to form in intermediate momentum indicators that a potential top is looming and upside potential could be limited. Stock and sector selection will be more important as the year moves forward. The upside target for the S&P 500 (SPY) remains at 228.00. For now the intermediate trend remain up. Quiet times are over, expect volatility, and more risk. Review your investments now before the bears take charge and the intermediate trend changes from bullish to bearish. The key number to watch on the S&P 500 (SPY) is 212.00. A close below 212.00 for two days would be a warning further decline is likely.
I would love to hear from you. Please call me at 516-829-6444 or email at bgortler@signalert.com sharing your thoughts, or ask me any questions you might have.
If you like this article, then you will love this!
Click here for a free report:
Top 10 investing Tips to More Wealth
*******Article in Systems and Forecasts Sept 15, 2016

Discover the right wealth building attitude…
Download a Free chapter of my book Journey To Wealth
Disclaimer: This is a hypothetical result and is not meant to represent the actual performance of any particular investment. Future results cannot be guaranteed. Although the information is made with a sincere effort for accuracy, it is not guaranteed either in any form that the above information is a statement of fact, of opinion, or the result of following any of the recommendations made herein. Readers are encouraged to meet with their own advisers to consider the suitability of investments discussed above for their own particular situations and for determination of their own risk levels.


Create more wealth in your life
with these simple strategies.
As an added bonus you will also
receive BG’s Updates and Ezine

Discover how to quickly create more well-being in your life with these simple strategies.
As an added bonus you will also
receive BG’s Updates and Ezine

As an added bonus you will receive BG’s Updates and Ezine

All work listed on BonnieGortler.com is licensed under a Creative Commons Attribution - Noncommercial - No Derivative Works 3.0 Unported License.
