

5 Investing Strategies to Save Money and Grow Wealth
04/11/2024
The Nasdaq Composite, Dow Jones Industrial Average, S&P 500 and the NYSE Composite Index all had a favorable start in 2017, breaking out to new record closing highs after 6 weeks spent consolidating within a tight trading range. The Dow made it through the psychological 20,000 milestone and the Transportation average confirmed the Dow Jones Industrials’ new high. International indices, which have struggled, came to life and have improving technical patterns.
However, in the past week the averages couldn’t hold onto all of their gains even though support levels remain intact. Our trading models remain neutral positive. Some signs of concern showed up the last few days in January. Investors’ selling was spurred by investors’ uncertainty about world events, interest rates rising, and potential disappointment in earnings by major companies including Apple (AAPL), Facebook (FB), and Amazon (AMZN). Apple’s earnings were well received by investors. Apple’s stock rose sharply, now less than 5% from its all-time high with a very favorable long term monthly chart. Facebook rose on their earnings announcement lifting its stock to new highs, followed by some profit taking.
The concern is some profit taking after the S&P 500 stalled just below its key level at 2300. In addition small caps (Russell 2000 Index) and the financial sector (XLF and KRE) which had led the market higher since the election have now started to weaken.
What ETF to Track to Signal Further Gains or Trouble Ahead?
SPDR S&P Regional Banking ETF Weekly Price and Trend Channels (Top), and RSI 14 (Bottom)
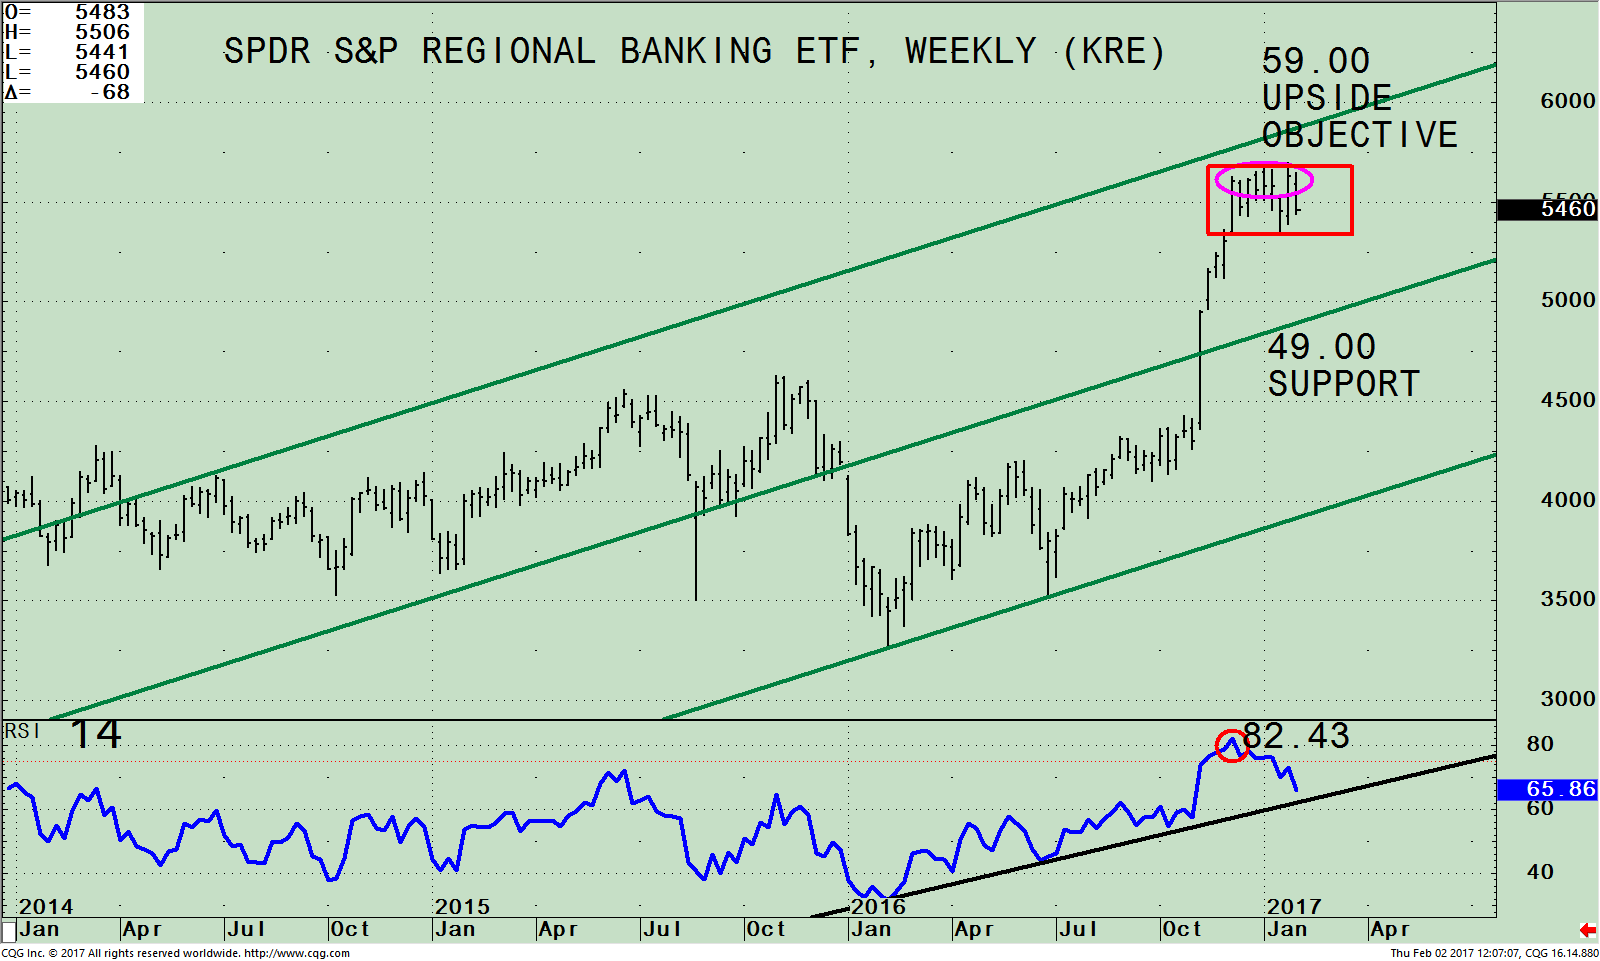
The top part of the chart shows the weekly Regional Banking Index (KRE), an exchange traded fund (ETF) that began in 2006. KRE tracks an equally weighted index of common stocks of leading regional banks or thrifts (savings and loan associations). As of 01/31/17 the top holdings of KRE are: M&T Bank Corporation (3.64%), PNC Financial Services Group I, (PNC) (3.64), Citizens Financial Group, Inc. (CFG) 3.60, Fifth Third Bancorp FITB 3.59 %, SunTrust Banks, Inc. (STI) 3.58%, BB&T Corporation (BBT) 3.57%, and Zions Bancorporation (ZION) 3.57% totaling 25.19%.
Notice the clear trading channel in the top chart (the three green lines). KRE is not for the faint of heart. It’s a volatile index that I monitor intraday for the trend of the market and potential trend changes. Another financial sector ETF to follow is the Financial Select Sector SPDR (XLF), which is quieter than KRE. After the election, investors very quickly moved assets into the financial sector fueling the rally that rocketed KRE from 43.59 to 49.87 in one week, a 14.41% gain. Four weeks later KRE rose further to 56.29 a 12.87% gain, breaking through its trading channel surpassing the high made in November 2015.
However, KRE has stalled, consolidating for 9 weeks. It looks like KRE is at a critical juncture now.
A break above 57.00 would suggest KRE will challenge the upper channel at 59 over the next few weeks. If KRE can get through the upper channel a higher objective would be given and this would also have bullish implication for the overall market.
However, a break below its consolidation, 53.40 (red rectangle) would imply a potential test of 49.00
A break below 49.00 would suggest a serious decline is imminent.
The bottom half of the chart shows the Relative Strength Index, a measure of momentum developed by Welles Wilder. RSI is based on the ratio of upward price changes to downward price changes. RSI reached 82.43 its highest weekly reading since the ETF began in 2006. RSI readings of 70 or higher show strength and are most times considered bullish. Generally as long as RSI stays above 40, the trend is up.
When you have a powerful thrust as KRE did on its most recent breakout, this is normally not a sign of a top. Most times you would get a relatively contained pullback or sideways consolidation before another rally attempt would occur. It’s also a bullish sign the uptrend in RSI from 1/16/16 remains intact. RSI has lost some momentum, however its normal that momentum temporarily weakens after a huge rally before the next leg higher. As long as the uptrend is in effect the odds favor the bulls. If the downtrend is broken (black line) a warning sign would be given.
Summing Up:
The stock market is off to a good start in 2017 as many major averages have made new all-time highs. Our models remain neutral-positive. However, uncertainty about world events, interest rates rising, and company earnings remain in investor’s minds. The momentum of the rally since the election has slowed and the market is consolidating it gains. I recommend keeping an eye on the SPDR S&P Regional Banking ETF (KRE) for a sign of further strength or weakness that would give the clue of a potential change. For now the bulls remain in control.
If you have questions or comments on this article, please feel free to contact me at bgortler@signalert.com; phone: 1-516-829-6444. I would love to hear from you.
If you like this article, then you will love this!
Click here for a free report: Top 10 investing Tips to More Wealth
*******Article in Systems and Forecasts February 3, 2017

Discover the right wealth building attitude…
Download a Free chapter of my book Journey To Wealth
Disclaimer: Although the information is made with a sincere effort for accuracy, it is not guaranteed that the information provided is a statement of fact. Nor can we guarantee the results of following any of the recommendations made herein. Readers are encouraged to meet with their own advisors to consider the suitability of investments for their own particular situations and for determination of their own risk levels. Past performance does not guarantee any future results.


Create more wealth in your life
with these simple strategies.
As an added bonus you will also
receive BG’s Updates and Ezine

Discover how to quickly create more well-being in your life with these simple strategies.
As an added bonus you will also
receive BG’s Updates and Ezine

As an added bonus you will receive BG’s Updates and Ezine

All work listed on BonnieGortler.com is licensed under a Creative Commons Attribution - Noncommercial - No Derivative Works 3.0 Unported License.
