

5 Investing Strategies to Save Money and Grow Wealth
04/11/2024
“The time of maximum pessimism is the best time to buy and the time of maximum
optimism is the best time to sell.” ~John Templeton
 New record closing highs seem to be a normal occurrence during 2017 as the Trump rally continues. Equity markets have been going up on expectations of increased infrastructure spending, decreased regulation, and lower corporate taxes. The advance has been broad, although some sectors have clearly been stronger than others.
Some major averages are near the top of their channels as some stocks have had hefty gains. There are many favorable looking charting patterns, while others are in the process of the beginning stages of a parabolic advance. This is a chart pattern in which prices rise (or fall) with an increasingly steep slope. When the advance stops, a large decline follows that you want to avoid.
Our trading models remain neutral positive and the tape remains bullish. The best kind of advance is the one where pullbacks are very minor and price continues higher, as investors wait for the decline which doesn’t happen. This appears to be what is happening now. The trend is your friend. For now, enjoy the ride.
PowerShares QQQ ETF (Nasdaq 100 Index) Weekly Price and Trend Channels (Top), and MACD 12-26-9 (Bottom)
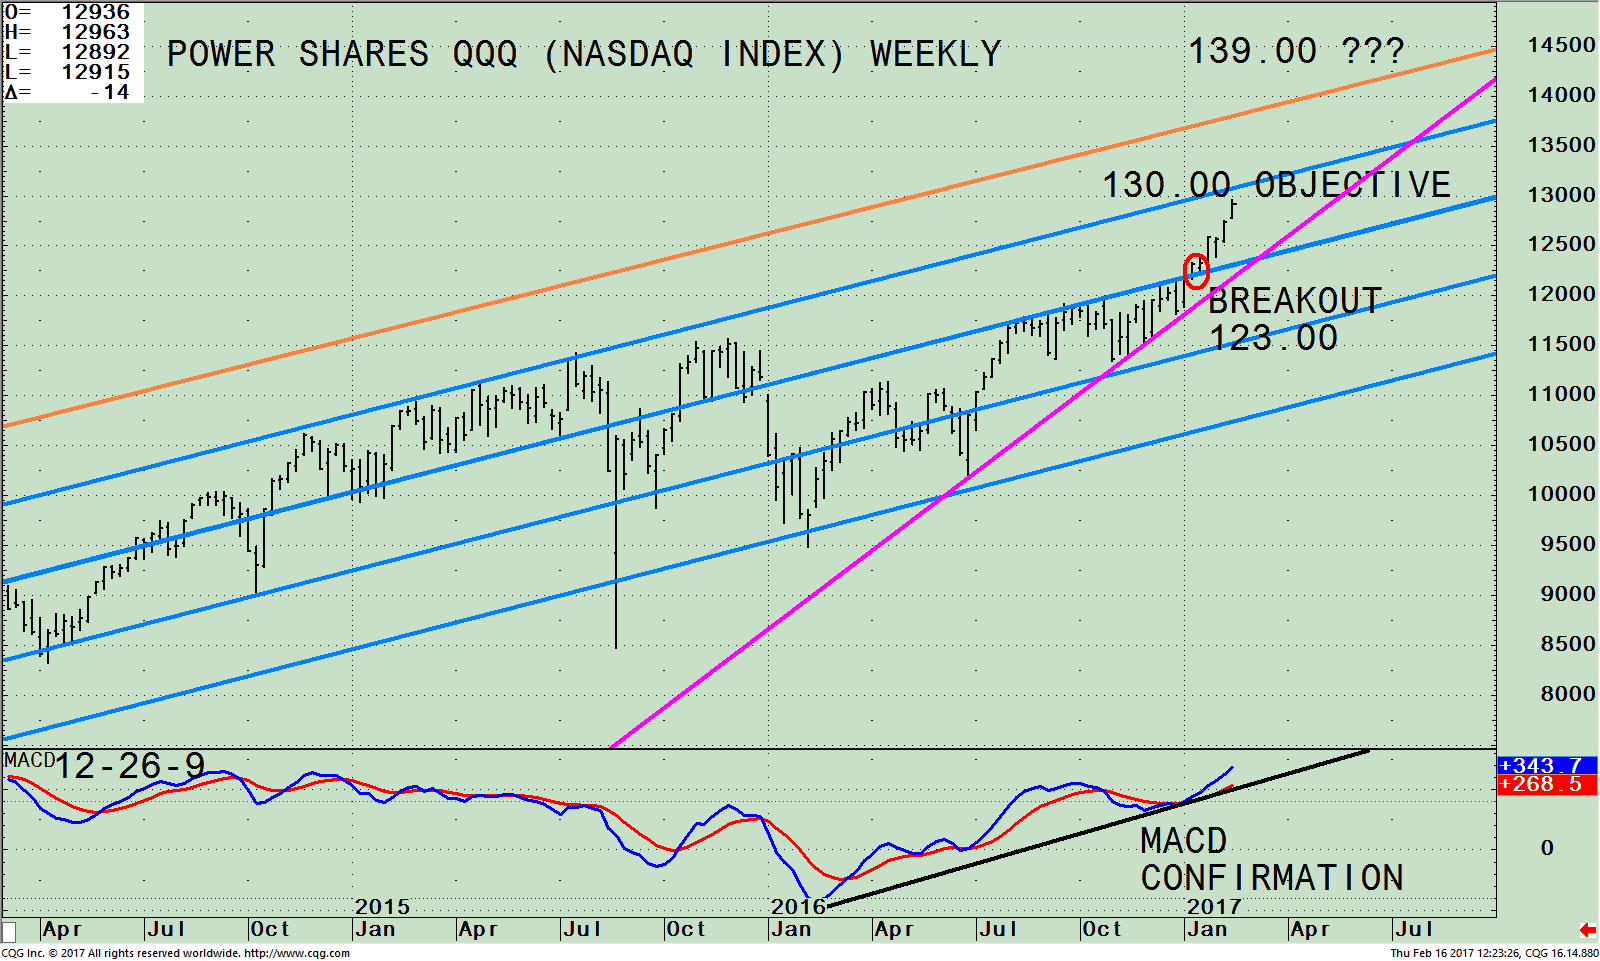
The top part of the chart shows the weekly Power Shares 100 (QQQ), an exchange-traded fund based on the Nasdaq 100 Index and its active trading channels. The QQQ includes 100 of the largest domestic and international nonfinancial companies listed on the Nasdaq stock market based on market capitalization.
As of 02/13/17, Apple, (AAPL) is the largest holding comprising 11.83%, Microsoft Corp (MSFT) 8.25%, Amazon.com, Inc. (AMZN) 6.53%, Facebook, Inc. Class A (FB) 5.15%. Alphabet Inc. Class C (GOOG) 4.65% and Alphabet Inc. Class A (GOOGL) 4.09%, totaling 40.50%. All the top holdings have rebounded this year after being out of favor before the election. Apple (AAPL), its largest holding has had significant gains already this year, and has higher upside projections that will help the QQQ, and has favorable implications for the technology area over the next several months.
Revisiting the article in the Systems and Forecasts newsletter on 01/13/17 “Breakout in Technology Looms”, QQQ looked poised for a breakout. This indeed did happen. The QQQ is getting close to its 130.00 objective, closing at 129.40 on 02/15/17.
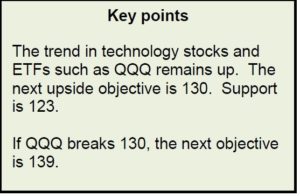
It looks like the QQQ could start another leg up, going through 130.00 to potentially reach 139.00 (orange line), the next target. As long as the QQQ is above the up trendline line, the trend is up. The trend line is important; it coincides with the break out at 123.00 that is now acting as support. For another leg up to start, the QQQ needs to close above 130.00 for 2days and declines should be contained between 1-3%. If the QQQ falls below the up trendline my bullish outlook will be negated.
The bottom half of the chart is MACD (12, 26, 9) a technical indicator that measures momentum. MACD is overbought, however still rising, and gaining momentum which is positive. MACD has confirmed the price high suggesting even if the QQQQ would decline another rally attempt would occur.
QQQ Performance Will Be Helped By Apple: Long Term Trend Is Up
AAPL Monthly Price and Up Trend Line (Top), and MACD 12-26-9 (Bottom)
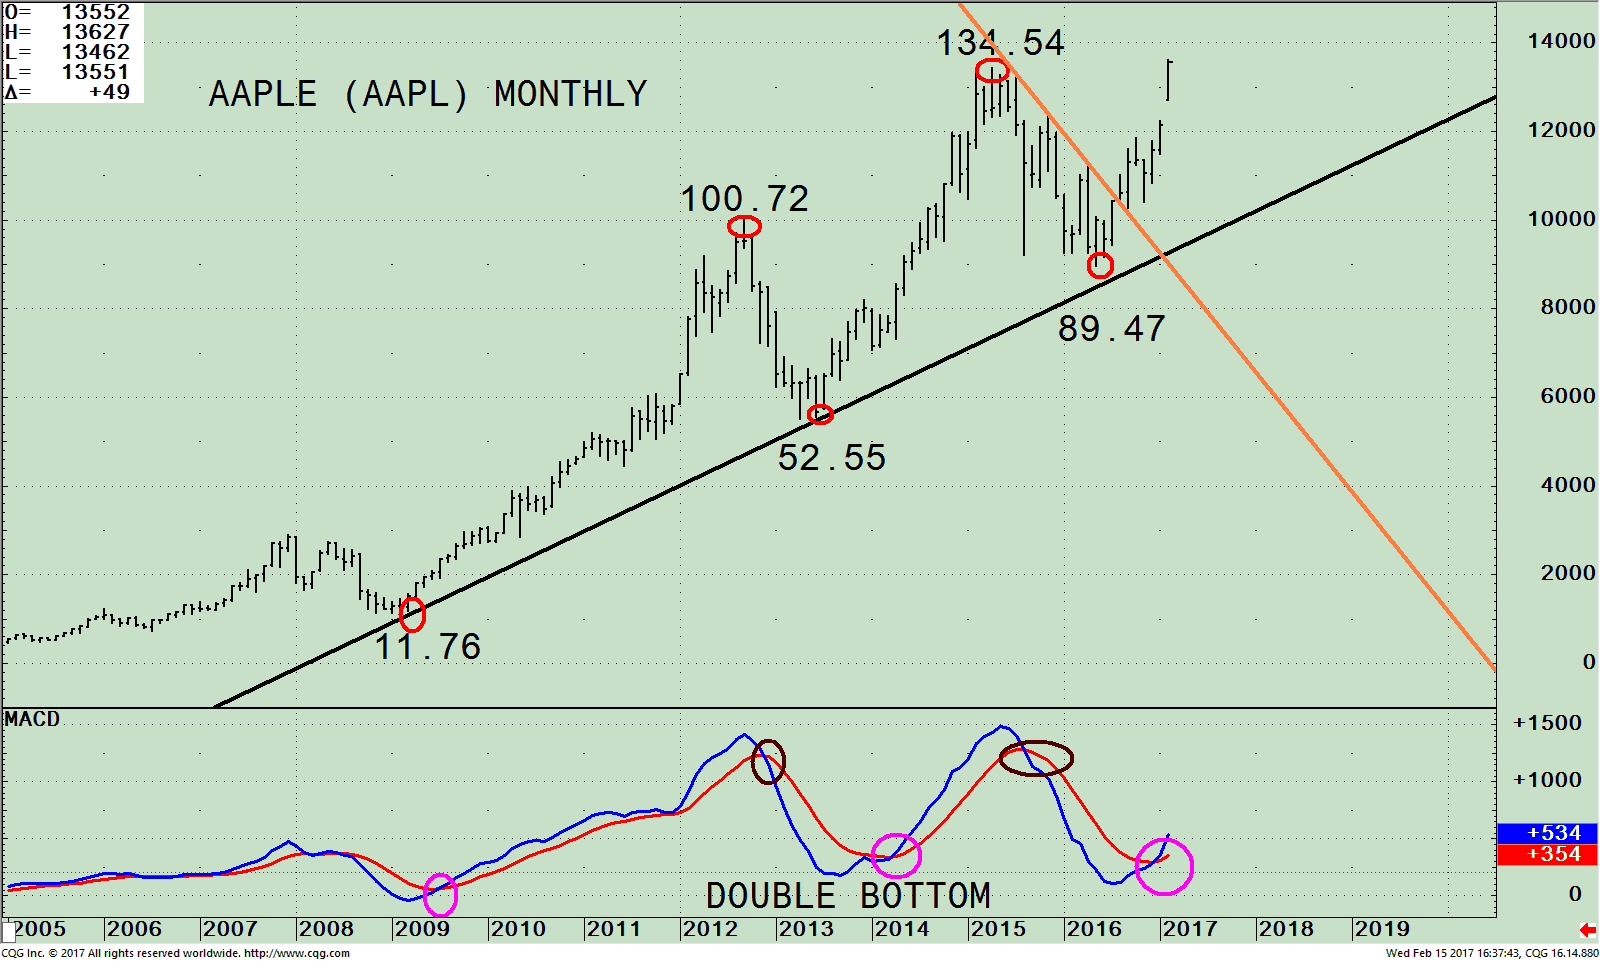
** Apple’s stock underwent a 7-for-1 split, giving 6 additional shares to each shareholder on 06/09/2014. The stock closed at 645 becoming 92.00/per share.
The top chart is a price chart that shows the high-low-close each month of Apple since 2005. The Black line is the prevailing key uptrend line. As long as Apple’s price is above the uptrend line, the trend is up and further profit potential on the long side is likely. Apple was under selling pressure since its high in April 2015, when it was out of favor by investors. In September 2016, Apple broke its down trend (orange line), and investors stepped in to buy. After its quarterly earnings were announced on 01/31/17, Apple gained 11.7% (121.35-135.60 as of 02/15/17 intraday) and then soared ahead breaking its all-time intraday high of $134.54 set in April 2015 on February 14, 2016.
The bottom half of the chart is MACD (12-26-9), a technical indicator that measures momentum. MACD is on a buy, and has a very favorable pattern turning up from an oversold condition below 0, where good buying opportunities develop. This certainly has been the case for Apple.
In 2009 MACD was oversold, below 0, and generated a buy. MACD rose into 2011 while MACD went sideways into 2012 as Apple stock continued to rise from 11.76 to 100.72, +756% gain. MACD turned down crossing its signal line in 2012, generating a sell in 2013. Apple fell from 100.72 to 52.55, a 47.8% loss. MACD then started to flatten out forming a rising double bottom formation (one of the most bullish formations to look for on charts and make money). Apple rose from 52.55 to 134.54, +156.0% gain. MACD peaked in 2015, turning down, losing momentum and Apple fell from 134.54 to 89.47, a -33.5% loss.
Apple’s latest rise off of the bottom is from 89.47 to 135.50, a gain of 51.5%. The good news is the MACD pattern remains very bullish even with its rise to new highs. Next objective is 155.00 and support is 127.00. There has been a definite shift in investor sentiment since the election and belief the company will benefit from potential changes down the road by President Trump. Time will tell.
Summing Up:
Major averages have made new all-time highs, a common theme of 2017. The advance that is taking place is the best kind of advance, one where pullbacks are very minor and price continues higher as investors wait for the decline. The Nasdaq 100 (QQQ) did break out in January, and could well be on its way to another 7% gain. The trend is up. Apple, its largest component has a very favorable MACD pattern suggesting there is more room to the upside on top of its recent gains. The trend is your friend. Enjoy the ride.
I would love to hear from you. Please call me at 516-829-6444 or email at bgortler@signalert.com to share your thoughts or ask me any questions you might have.
Disclaimer: Although the information is made with a sincere effort for accuracy, it is not guaranteed that the information provided is a statement of fact. Nor can we guarantee the results of following any of the recommendations made herein. Readers are encouraged to meet with their own advisors to consider the suitability of investments for their own particular situations and for determination of their own risk levels. Past performance does not guarantee any future results.
If you like this article, then you will love this!
Click here for a free report: Top 10 investing Tips to More Wealth
*******Article in Systems and Forecasts February 16, 2017

Discover the right wealth building attitude…
Download a Free chapter of my book
Journey To Wealth
Disclaimer: Although the information is made with a sincere effort for accuracy, it is not guaranteed that the information provided is a statement of fact. Nor can we guarantee the results of following any of the recommendations made herein. Readers are encouraged to meet with their own advisors to consider the suitability of investments for their own particular situations and for determination of their own risk levels. Past performance does not guarantee any future results.


Create more wealth in your life
with these simple strategies.
As an added bonus you will also
receive BG’s Updates and Ezine

Discover how to quickly create more well-being in your life with these simple strategies.
As an added bonus you will also
receive BG’s Updates and Ezine

As an added bonus you will receive BG’s Updates and Ezine

All work listed on BonnieGortler.com is licensed under a Creative Commons Attribution - Noncommercial - No Derivative Works 3.0 Unported License.
