

Bonnie’s Market Update 4/12/24
04/14/2024
February had a strong month of gains following January’s advance. The Dow Industrials rose 12 straight days. Healthcare (XLV), Utilities, and Financials were the leading sectors for the month along with solid gains by the Dow, S&P 500, and the Nasdaq. Our trading models remain neutral-positive and the tape remains bullish. Up trends are intact. Some indices have met their intermediate channel objectives including Regional Banks, (KRE) Nasdaq 100 (QQQ), and Russell 2000 (IWM); however there is a good chance more gains are ahead. The bulls remain in control.
What Do You Want To Watch Now?
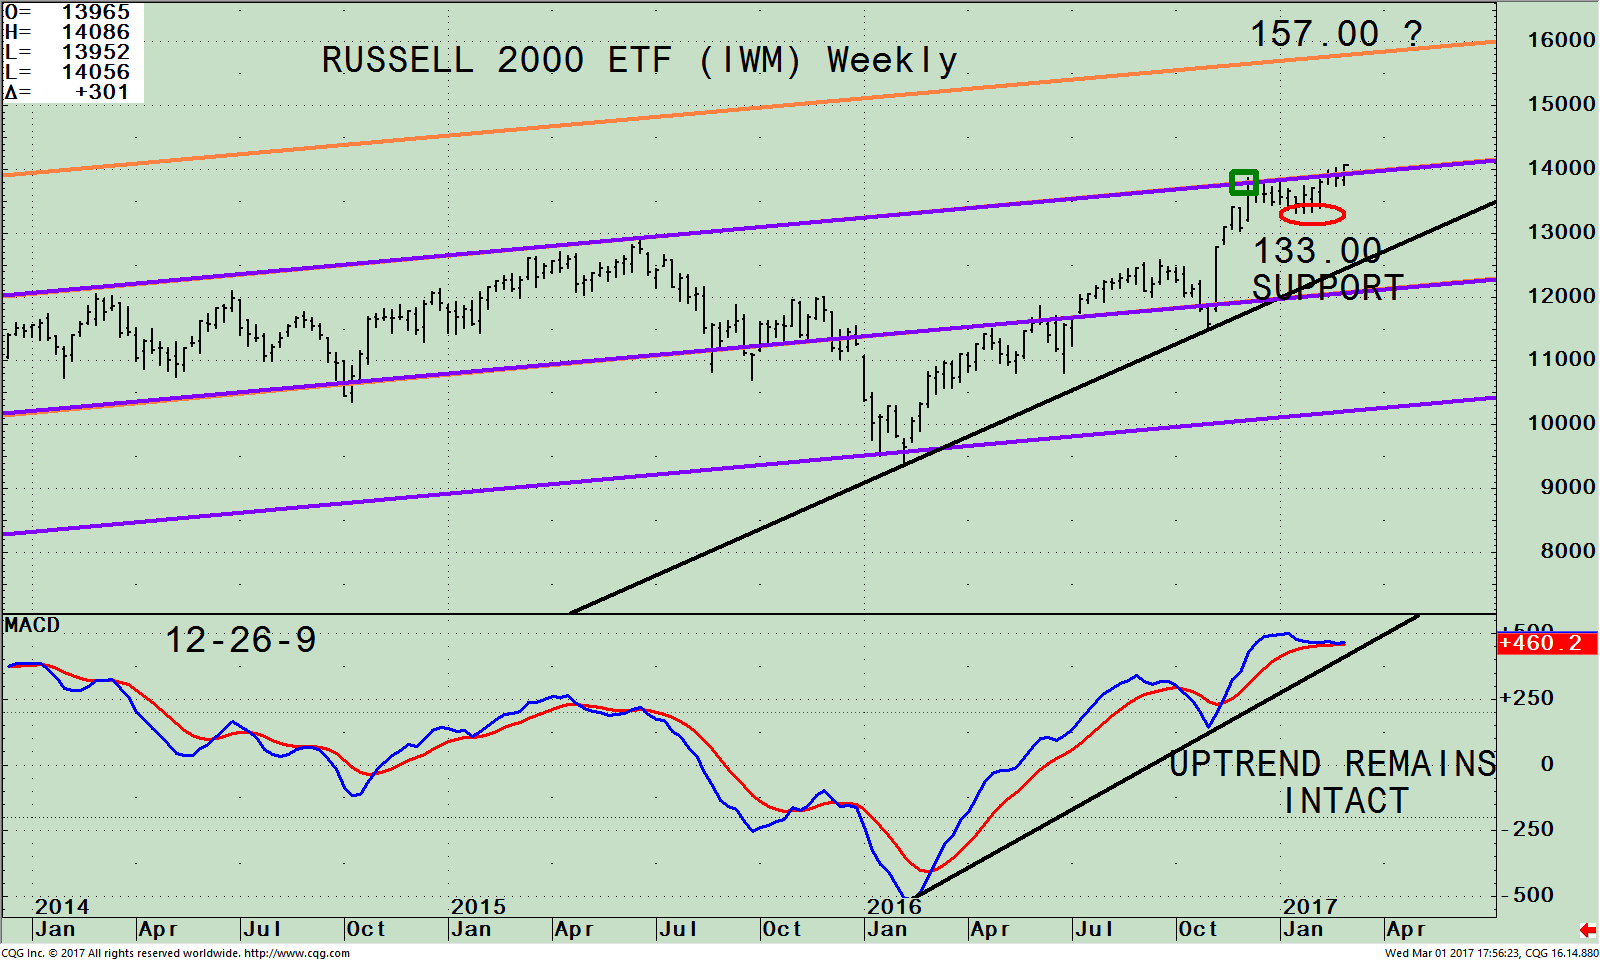
The top portion of the chart shows the weekly iShares Russell 2000 Index ETF (IWM) which is made up of companies with a market capitalization of between $300 million and $2 billion. After the election the Russell 2000 (IWM) skyrocketed. The IWM made a high of 138.85 on 12/08/16 overshooting slightly its channel objective at 138.00 (green rectangle). After making a high, the IWM moved sideways for about 8 weeks, not giving up much ground.
As of March 1st, a potential breakout may have begun. The upside objective is 157.00 while support is at 133.00.
The lower portion of the chart is MACD, a technical indicator that measures momentum. MACD is overbought, confirming the new high made in IWM. If the rally stalls MACD can give a sell quickly. Its bullish, the uptrend from January 2016 is in effect, and MACD has confirmed the IWM high.
iShares Russell 2000 ETF (IWM) Weekly Price (Top), and 12-26-9 Week MACD (Bottom)
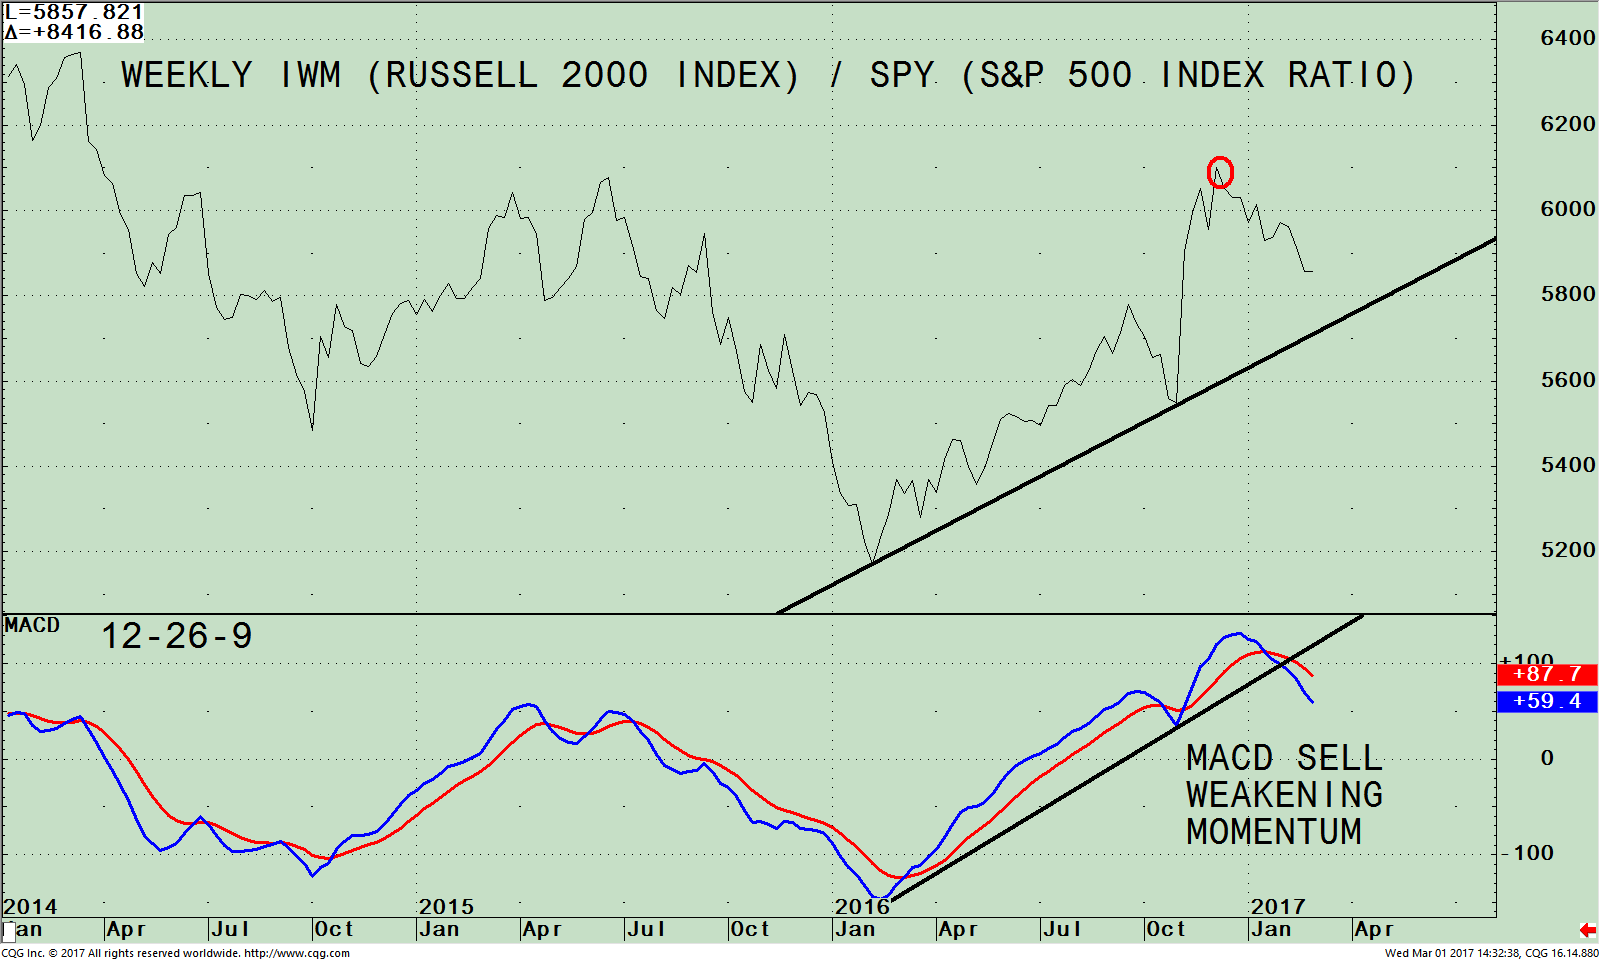
The top part of the chart is the weekly (IWM) Russell 2000 Index / (SPY) S&P 500 Index Ratio (IWM/SPY). A rising line means the IWM is stronger, and if falling, the SPY is stronger. The IWM/SPY ratio peaked on 12/05/16. The IWM has clearly been losing strength, however the uptrend from January 2016 (black line) is intact.
The lower portion of the chart is MACD, already on a sell warning of a potential change of leadership. Not only is momentum weakening, but at the same time the IWM/SPY relative strength ratio has broken it’s up trend. Also, the average daily trading range for the past 25 days has been more than double the SPY. Even though the IWM has the potential to be breaking out, if you are heavily weighted in small caps, it may be a good time to reduce your exposure and lower your risk, shifting part of your assets to the SPY.
The SPDR S&P 500 (SPY) Weekly With Channel (Top) and Weekly 12-26-9 MACD (Bottom)
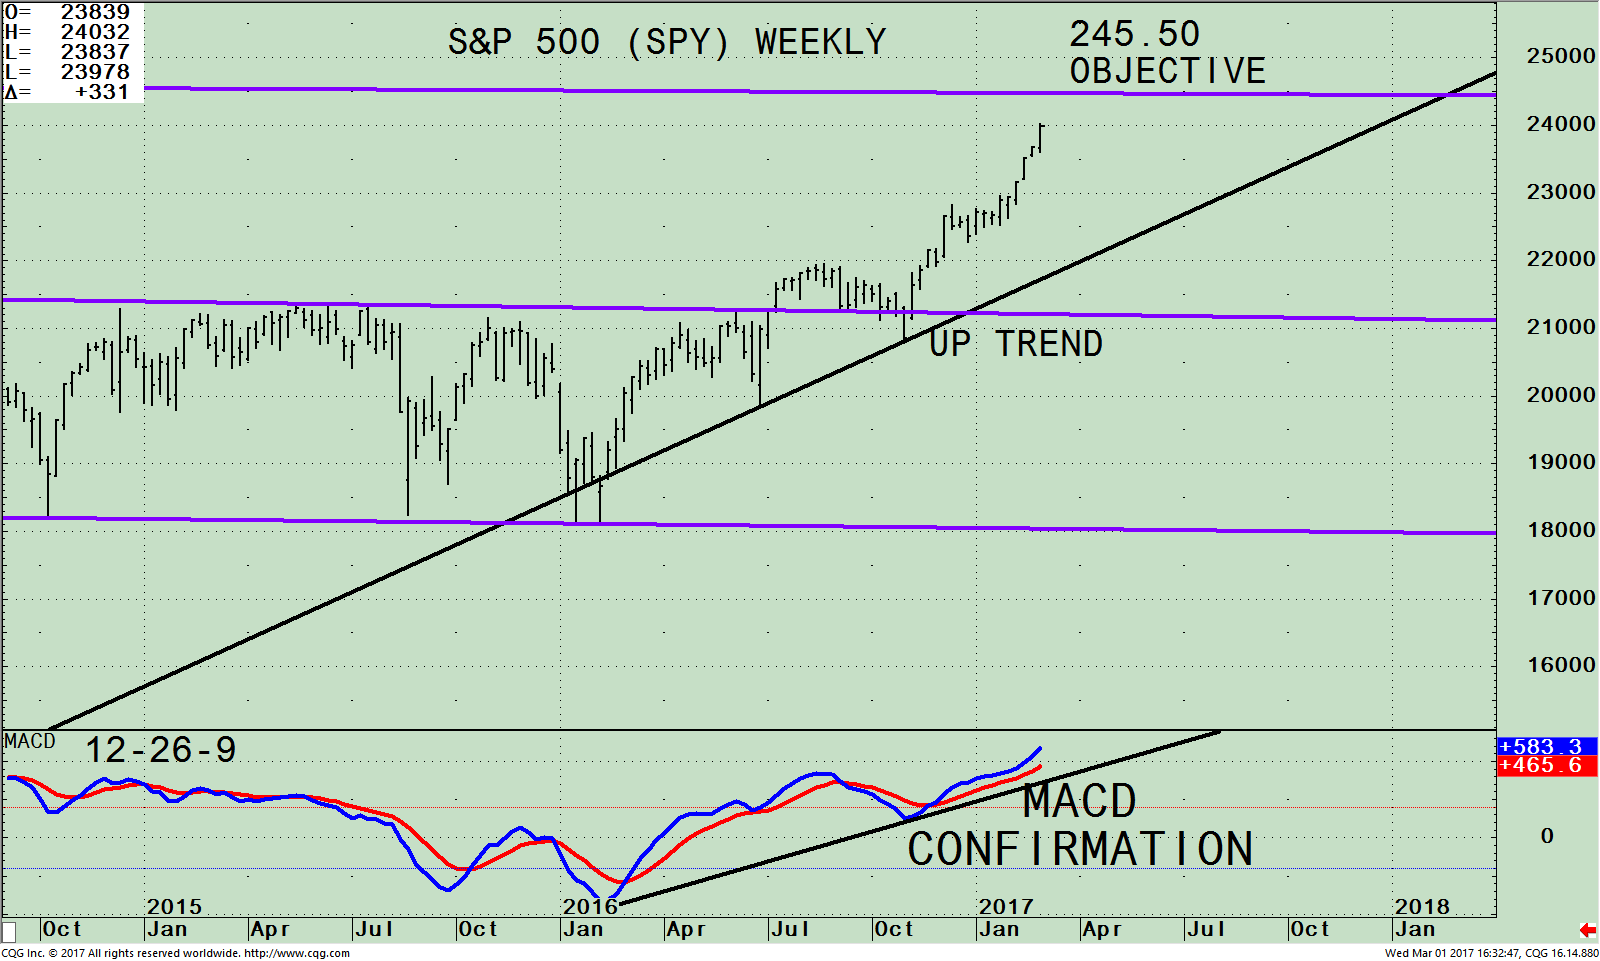
The chart above is the weekly SPDR S&P 500 (SPY) ETF that is comprised of 500 stocks of the largest companies in the U.S. As of 03/01/17 its top 4 holdings in the S&P 500 were Apple Inc. (AAPL) 3.58%, Microsoft Corporation (MSFT) 2.45%, Exxon Mobil Corporation (XOM), 1.66% and Johnson & Johnson (JNJ) 1.64%. Investing in the S&P 500 gives you a broad representation of the overall large-cap U.S. stock market.
The top part of the chart shows the S&P 500 (SPY) weekly trading channel. The S&P 500 (SPY) has been in an uptrend since December 2016 and steadily rising since the election. While the Russell 2000 (IWM) is at its top of its trading channel, the SPY still has some room to go before hitting its upper channel at 245.50.
The bottom half of the chart shows MACD, confirming the highs in the SPY. This is bullish.
Just To Sum Up:
The tape remains strong. Major averages continue to make new highs and pullbacks have been minor. The Russell 2000 (IWM) has met its intermediate objective. The SPY has taken over leadership in terms of relative strength. Even though the IWM has the potential for a break out, if you are heavily weighted in small caps, it may be a good time to reduce your exposure, lowering your risk by shifting part of your assets to the SPY. Our models remain overall neutral-positive so stocks could rise for several more weeks. As long as the Russell 2000 (IWM) stays above its support at 133.00 and the SPY stays above its hourly support of 234.00, you can expect higher highs. Continue to give the benefit of the doubt to the bulls.
I would love to hear from you. Please call me at 516-829-6444 or email at bgortler@signalert.com to share your thoughts or ask me any questions you might have.
If you like this article, then you will love this!
Click here for a free report: Top 10 Investing Tips To More Wealth
*******Article in Systems and Forecasts March 2, 2017

Discover the right wealth building attitude…
Download a Free chapter of my book
Journey To Wealth
Disclaimer: Although the information is made with a sincere effort for accuracy, it is not guaranteed that the information provided is a statement of fact. Nor can we guarantee the results of following any of the recommendations made herein. Readers are encouraged to meet with their own advisors to consider the suitability of investments for their own particular situations and for determination of their own risk levels. Past performance does not guarantee any future results.


Create more wealth in your life
with these simple strategies.
As an added bonus you will also
receive BG’s Updates and Ezine

Discover how to quickly create more well-being in your life with these simple strategies.
As an added bonus you will also
receive BG’s Updates and Ezine

As an added bonus you will receive BG’s Updates and Ezine

All work listed on BonnieGortler.com is licensed under a Creative Commons Attribution - Noncommercial - No Derivative Works 3.0 Unported License.
