

5 Investing Strategies to Save Money and Grow Wealth
04/11/2024
U.S. stocks were quiet early in March as the major averages traded in narrow ranges closing at the end of the day near their highs. This phenomenon changed as the month moved on. Buyers turned to sellers. The S&P 500 was down more than 1% in a single day, which didn’t happen for 5 months previously. The Financial sector and Small Cap sector that led the market higher weakened. Technical momentum oscillators were extended, showing loss of momentum, ripe for a short term pullback. The short term trend changed from up to down (based on charting methods).
What ETF to Watch To Guide You for Direction?
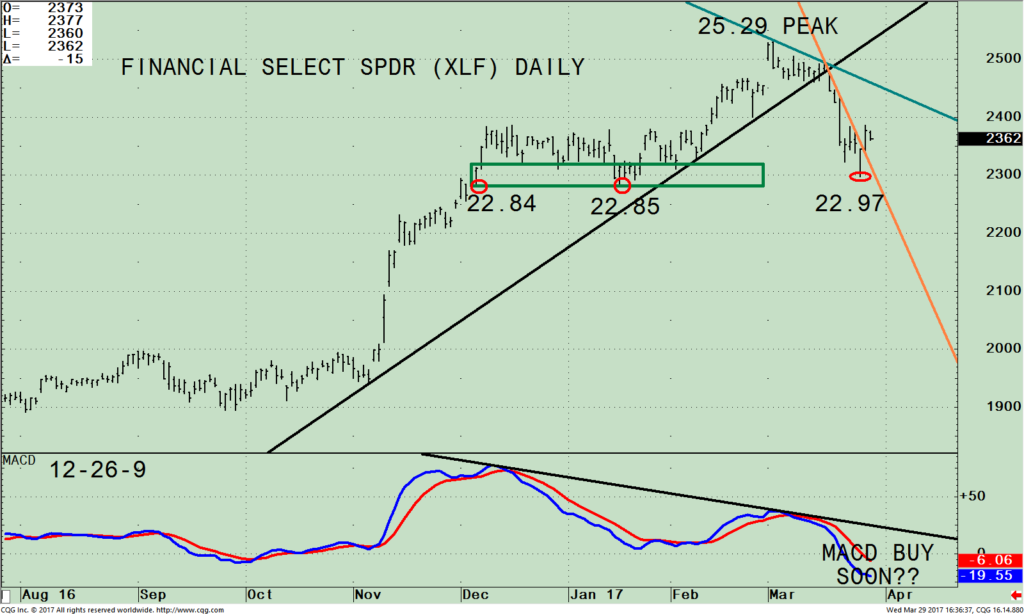
SPDR S&P Financial Select SPDR ETF (XLF) Daily Price (Top), and MACD 19-26-9 (Bottom)
The top part of the chart shows the weekly Financial Sector SPDR (XLF), an exchange traded fund (ETF) that tracks a mix of diversified financial service firms, insurance, banks, capital markets, consumer finance and thrift companies. As of 03/28/17 the top holdings of XLF are: Berkshire Hathaway B, (BRK.b) 10.97%, JP Morgan Chase & Co (JPM) 10.86%, Wells Fargo & Co (WFC) 8.65%, Bank of America Corp (BAC) 8.08, and Citigroup Inc. (C), 5.65%. Historically it’s a sign of a healthy market when financial stocks are strong, showing signs there is economic growth. The S&P 500 (SPY) also tends to do well because the S&P 500 index has 16.48% of its holdings in the financial sector, only the technology sector is higher at (19.25 % through 02/27/17.
Investors shifted assets to financial stocks after the election. The XLF peaked at 25.29 on 03/02/17. A pullback followed a few weeks later, breaking its short term trend up trend on 03/17/17, two days before the S&P 500 (SPY) broke their daily trend line. Notice how the XLF retraced all of its 2017 gains, stopping above a key support area (green rectangle), at 22.97, holding above the December 2016 low at 22.84.
Many times once an uptrend is broken after a test of an important support area, another rally attempt will occur. This looks like what is happening now. The XLF just penetrated its down trend, a positive sign for a short term rally to begin. If the decline is over, the XLF should challenge its down trend line from the peak, around 24.50, (green line). If the XLF stalls and turns lower, then look for another test of the support area. A break below would be considered bearish. A break above 24.50 would suggest another attempt at the March highs.
The bottom half of the chart is MACD (12, 26, 9) a technical indicator that measures momentum. MACD is now oversold, below 0, and has a favorable pattern forming. If the XLF rises for a few days in a row a buy will be generated. Keep an eye out for the downtrend in MACD to be broken. This would confirm the short term decline is over and further gains are ahead.
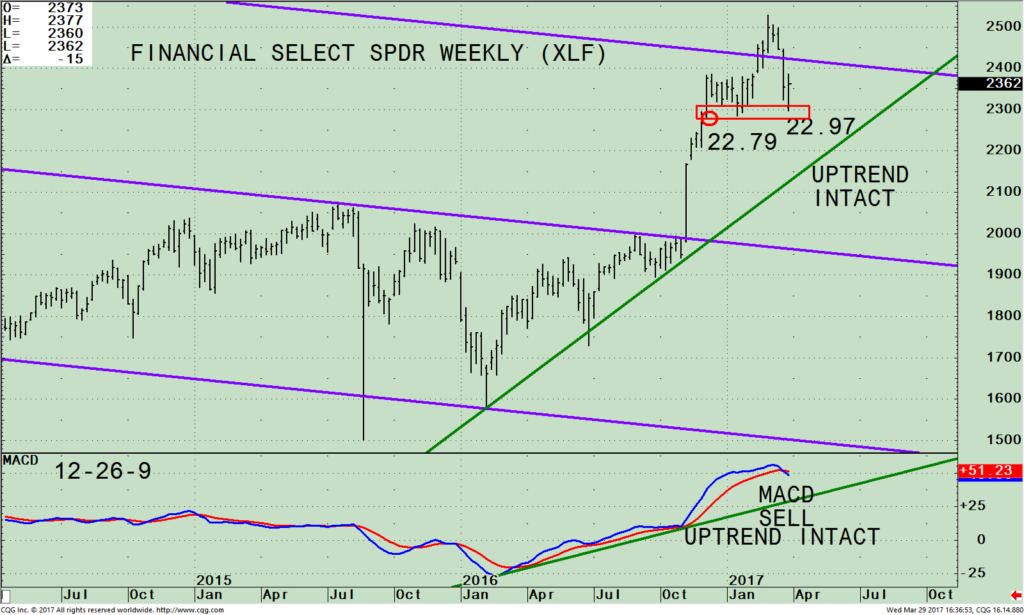
SPDR S&P Financial Select SPDR ETF Weekly Price (Top), and MACD 19-26-9 (Bottom)
The top portion shows the weekly SPDR S&P Financial Select SPDR ETF (XLF) active trading channel (purple lines). The XLF had a huge advance, breaking through its upper channel. However, a false breakout materialized, the XLF couldn’t sustain its rise and the XLF declined by 9.2%, holding above its weekly low made in December 2016 (red circle). The intermediate trend is up. The uptrend remains intact.
A break below the recent low at 22.97 would increase the odds of a further decline that would potentially break the uptrend, and would shift the intermediate trend from up to down.
The bottom half of the chart is MACD (12, 26, 9) a technical indicator that measures momentum. MACD has just given a sell. But I am not worried about this MACD sell because it was not accompanied by a negative divergence. Moreover MACD did make a new peak to confirm the price high and its uptrend is intact. Usually when you have a powerful thrust as XLF did, another rally attempt occurs after the first decline. As long as the uptrend is in effect the odds favor the bulls. If the downtrend is broken (black line) a warning sign would be given and the bears most likely would come out of hiding.
In Sum:
Our equity models remain overall neutral-positive, implying further gains are likely for the intermediate term (weeks–months). Look for wider intraday swings, as the historically favorable seasonal period will be ending in April. Financials have lost some of the luster they had early in the year but resurgence could begin soon. The recent decline appears to be over if the recent low at 22.97 holds. As long as the uptrends remain intact for the intermediate term (weekly chart) in terms of price and MACD, give the benefit of the doubt to the bulls. Time will tell.
I would love to hear from you. Please call me at 516-829-6444 or email at bgortler@signalert.com to share your thoughts or ask me any questions you might have.
If you like this article, then you will love this!
Click here for a free report: Top 10 Investing Tips To More Wealth
*******Article published by Bonnie Gortler in Systems and Forecasts March 30, 2017

Discover the right wealth building attitude…
Download a Free chapter of my book
Journey To Wealth
Disclaimer: Although the information is made with a sincere effort for accuracy, it is not guaranteed that the information provided is a statement of fact. Nor can we guarantee the results of following any of the recommendations made herein. Readers are encouraged to meet with their own advisors to consider the suitability of investments for their own particular situations and for determination of their own risk levels. Past performance does not guarantee any future results.


Create more wealth in your life
with these simple strategies.
As an added bonus you will also
receive BG’s Updates and Ezine

Discover how to quickly create more well-being in your life with these simple strategies.
As an added bonus you will also
receive BG’s Updates and Ezine

As an added bonus you will receive BG’s Updates and Ezine

All work listed on BonnieGortler.com is licensed under a Creative Commons Attribution - Noncommercial - No Derivative Works 3.0 Unported License.
