

Bonnie’s Market Update 4/12/24
04/14/2024
No one really knows if the old adage sell and go away in May will hold true for 2017. What is known is May has begun quietly as the S&P 500 remains in a narrow trading range on less than inspiring momentum. However, the present tape action is a far cry from bear market action.
The technology sector continues to soar to new highs. In the 02/16/17/ Issue of Systems and Forecasts I brought attention to the possibility of another leg up for Technology, revisiting the article on 01/13/17 “Breakout in Technology Looms”, QQQ looked poised for a breakout. This indeed has occurred. The QQQ original objective was 130.00, followed by 139.00. On 05/09/17 the QQQ made an intra-day high of 138.93, meeting the upside objective.
The Tape Remains Mostly Bullish
PowerShares QQQ ETF (Nasdaq 100 Index)
Weekly Price and Trend Channels (Top), and MACD 12-26-9 (Bottom)
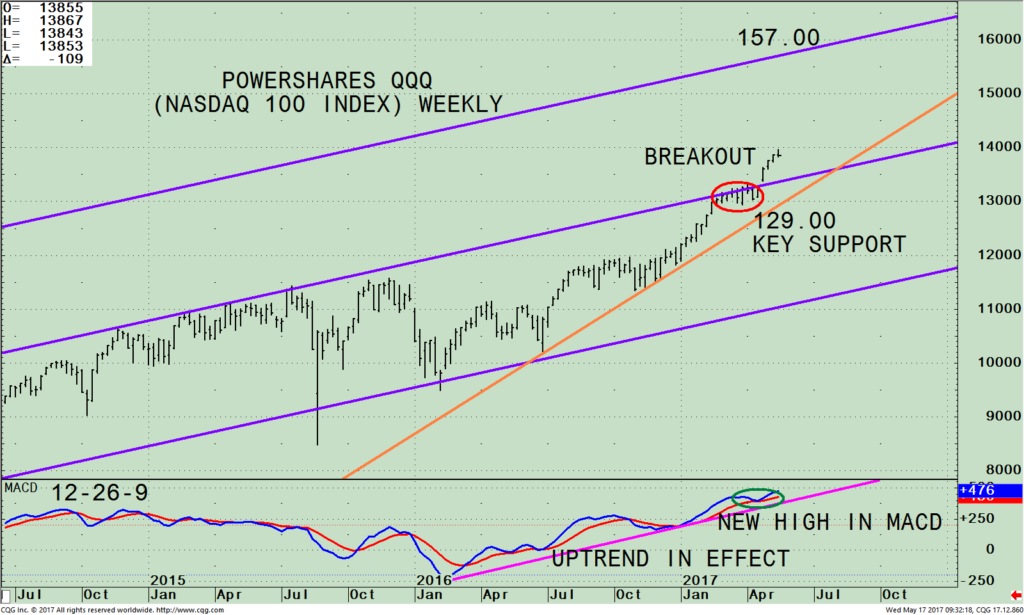
The top part of the chart shows the weekly Power Shares 100 (QQQ), an exchange-traded fund based on the Nasdaq 100 Index and its operative trend channel. The QQQ includes 100 of the largest domestic and international nonfinancial companies listed on the Nasdaq stock market based on market capitalization. The top holdings are Apple, (AAPL), Microsoft Corp (MSFT), Amazon.com, Inc. (AMZN), Facebook, (FB) and Alphabet Inc. (GOOG) and all have been climbing.
The Nasdaq 100 (QQQ), led by Apple is red-hot and looks as if there is more room to the upside. In the latest issue, I pointed out it’s necessary to watch and see if MACD made a higher high or if MACD turns down. Notice the lower chart. MACD made a new high confirming the high made by QQQ. This confirmation suggests the odds favor an extension of the rise and has bullish implications going forward over the next several weeks to months. Any weakness now should be contained and only be temporary before another rally attempt would occur.
If the QQQ falls below support at 129.00, just under where the QQQ consolidated early this year, much more caution is necessary.
In Sum:
The QQQ intermediate uptrend remains in effect (orange line). The upside target for the QQQ is 157.00. The breakout is in process. Time is now on the side of the bulls.
Apple Charges Ahead Leading the Technology Sector Higher
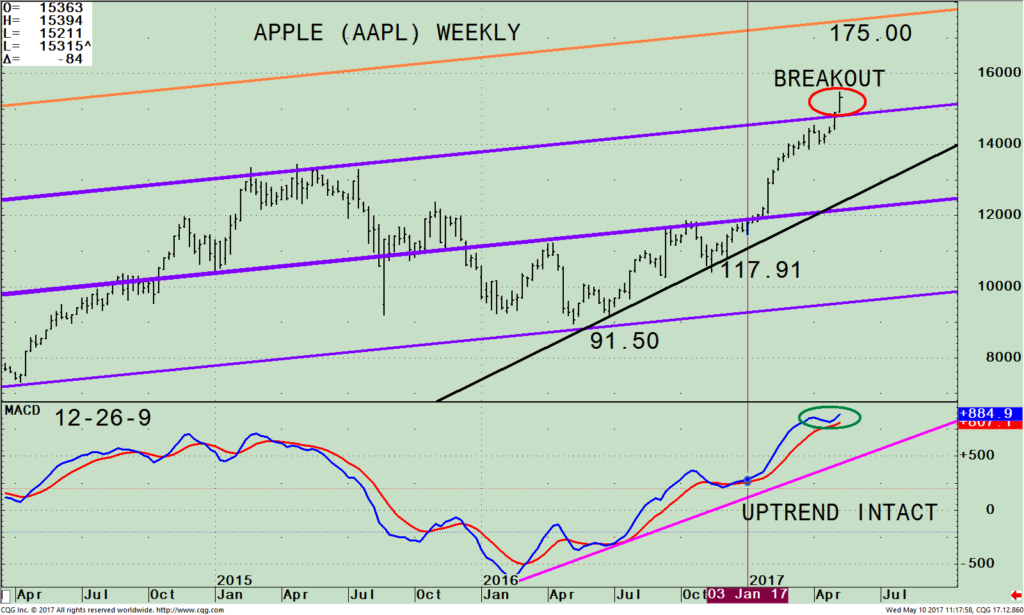
The top half is a price chart showing the weekly high-low-close of Apple since April 2014. Apple was out of favor in 2015, until June 2016 when investors selling turned into buying. A clear uptrend is in effect (black line). As long as Apple is above the trend line, the intermediate trend is up.
Apple has had explosive momentum in 2017, going from 117.91 to 154.08, a gain of 30.68 %. Notice how Apple this week has penetrated the upper channel. This is a bullish breakout giving a new channel upside objective to 175.00 (orange line). A test of the breakout could occur in the near term, amounting to only 2.00% – 3.00%. However the recent thrust suggests the advance will continue and declines would be very minor.
The bottom half of the chart is MACD (12-26-9), a technical indicator that measures momentum. MACD has confirmed the Apple’s price high (green circle) similar to the QQQ. A solid uptrend remains intact.
Summing Up:
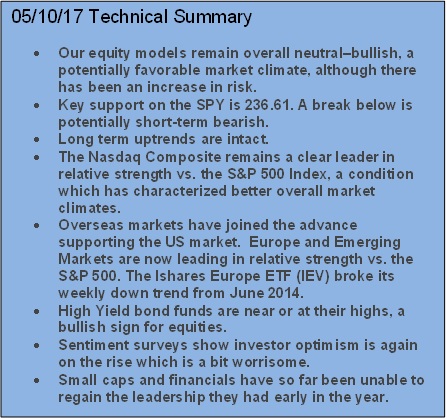
Our equity models remain overall neutral–bullish, a potentially favorable market climate, although there has been an increase in risk. Technology stocks remain the leader supporting the overall market. MACD on the Nasdaq 100 (QQQ) and Apple (AAPL) has confirmed the recent price highs. The intermediate uptrend in Nasdaq (QQQ) and Apple (AAPL) are solidly intact. The Nasdaq 100 (QQQ) has an upside target of 157.00 and Apple has an upside target to 175.00. This could be the year where you don’t want to go away and sell in May.
I would love to hear from you. Please call me at 516-829-6444 or email at bgortler@signalert.com to share your thoughts or ask me any questions you might have.
If you like this article, then you will love this! Free Instant Access to Grow Your Wealth and Well-Being E-Book HERE

*******Article published by Bonnie Gortler in Systems and Forecasts May 11, 2017
Disclaimer: Although the information is made with a sincere effort for accuracy, it is not guaranteed that the information provided is a statement of fact. Nor can we guarantee the results of following any of the recommendations made herein. Readers are encouraged to meet with their own advisors to consider the suitability of investments for their own particular situations and for determination of their own risk levels. Past performance does not guarantee any future results.


Create more wealth in your life
with these simple strategies.
As an added bonus you will also
receive BG’s Updates and Ezine

Discover how to quickly create more well-being in your life with these simple strategies.
As an added bonus you will also
receive BG’s Updates and Ezine

As an added bonus you will receive BG’s Updates and Ezine

All work listed on BonnieGortler.com is licensed under a Creative Commons Attribution - Noncommercial - No Derivative Works 3.0 Unported License.
