

Bonnie’s Market Update 4/12/24
04/14/2024
The Dow, S&P 500, and Nasdaq have completed one of the best January through June periods since 2009. The Nasdaq Composite was the strongest of 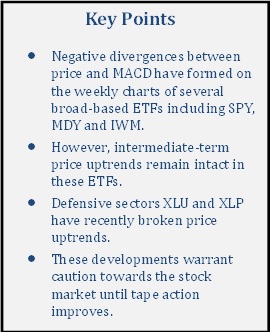 the three averages. However, during the last few weeks, technology was under more selling pressure than the other major averages. Intermittent rallies have been suspect.
Up until now, most price uptrends remain intact as declines have been contained. When a decline has occurred, buyers have stepped in to stabilize the market. Key support levels have held. In the past, when the first half of the year was positive, the odds favored further gains for the remainder of the year. However, this may not be the case this year. The second half of this year could be a bumpier ride, along with increased volatility and sector rotation.
Other sectors in addition to the Nasdaq have clear negative momentum patterns for the short, intermediate, and long term. Clear negative divergences are showing up in MACD. So far price trends remain up on most the major averages. However if more uptrends are broken, a more serious decline could begin. I am recommending review your portfolio, have an exit strategy ready to put into action in case further short term selling continues. Caution is warranted until the tape action improves.
Intermediate-term charts suggest caution: Momentum is undoubtedly weakening.
SPDR S&P 500 (SPY) Weekly ETF (Top) and 12-26-29 MACD (Bottom)
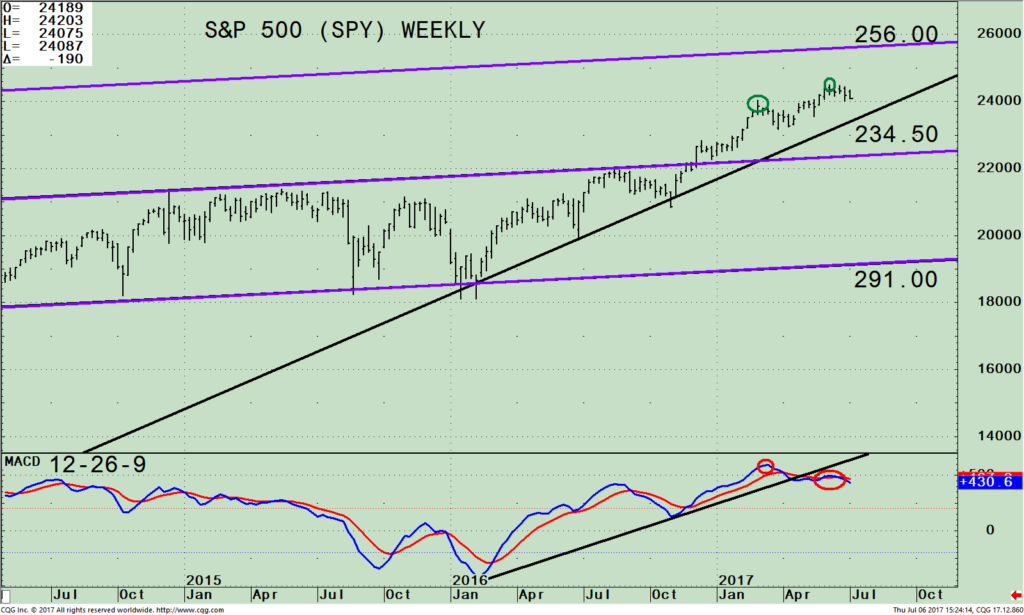
The top portion of the chart is the weekly SPDR S&P 500 ETF (SPY) that is comprised of 500 stocks of the largest companies in the U.S. The S&P 500 (SPY) has been in a weekly uptrend since 2016. The SPY stalled early in late February at 240.32, failing to reach the upside channel. The SPY then pulled back to 3.62% to 231.61 before proceeding to make another higher high on June 5, 2017. Once again the SPY failed to reach the upper channel. When the top of a trading channel is not reached on the second attempt, it’s normally not a good sign. A break below 234.50 on closing basis would break the uptrend.
More time is needed before another rally attempt or a decline begins. The encouraging sign is the uptrend remains in effect (black line) from January 2016. If the SPY turns higher and can get through the old highs, then a rally attempt towards the upper channel objective 256.00 would be possible.
The lower portion of the chart is the 12-26-9 MACD, a measure of momentum. MACD confirmed the price high of the S&P 500 (SPY) in March, suggesting another rally attempt would occur. After a short pullback the SPY did indeed rally to make a new high. However, MACD was unable to confirm the high (red circles), and MACD has also broken its uptrend from January 2016 (black line). This is a clear warning sign risk is increasing.
ETF Corner: Negative Divergences Have Formed on Weekly Charts
Weekly Price – Utilities SPDR (XLU), SPDR S&P MidCap 400 (MDY), iShares Russell 2000 Index (IWM), Consumer Staples Select Sector SPDR (XLP), (top of charts) and MACD 12-26-9 (bottom of charts).
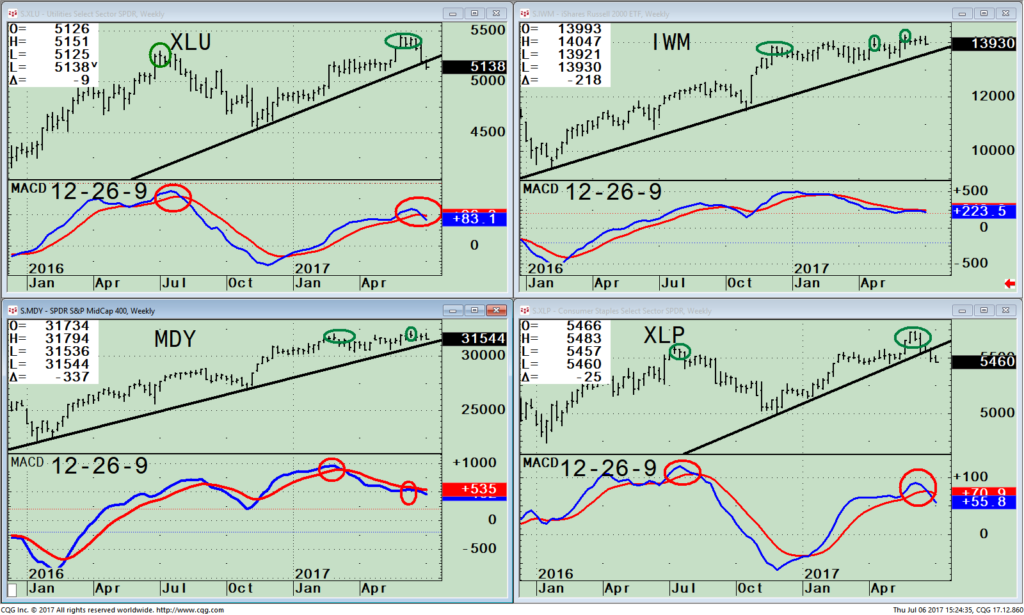
Similar to the Nasdaq and the S&P 500 (SPY), prices have made a higher high (green circles) during the latest rally in the broad market. Notice the top chart of iShares Russell 2000 (IWM) and SPDR S&P Mid Cap 400 (MDY) above. Price has also made a higher high in the following defensive sectors. See the top chart of the Utilities SPDR (XLU), and Consumer Staples Select Sector SPDR (XLP) above (green circles).
However, notice the weakening momentum patterns forming. MACD in all four ETF’s have failed to confirm their price highs (red circles). A clear negative divergence has formed. Weekly MACD suggests further price gains could be limited and these sectors could continue to struggle as investors rotate into other areas of the market.
The Consumer Staples (XLP) and Utilities (XLU) weekly price uptrend have also been broken (black line). The weekly/intermediate trend is now down, increasing the odds of a more serious decline.
The Russell 2000 (IWM) and S&P Mid Cap 400 (MDY) remain in price uptrends, positive for now. However, I recommend watching carefully if they also break their intermediate price uptrend. If this happens, expect more selling pressure to occur on the overall market. Key support on IWM is 137.00. A break below on a closing basis would mean potential trouble ahead. New buying is not advised at this time.
The SPDR S&P 500 (SPY) Daily Price And Key Uptrend Line
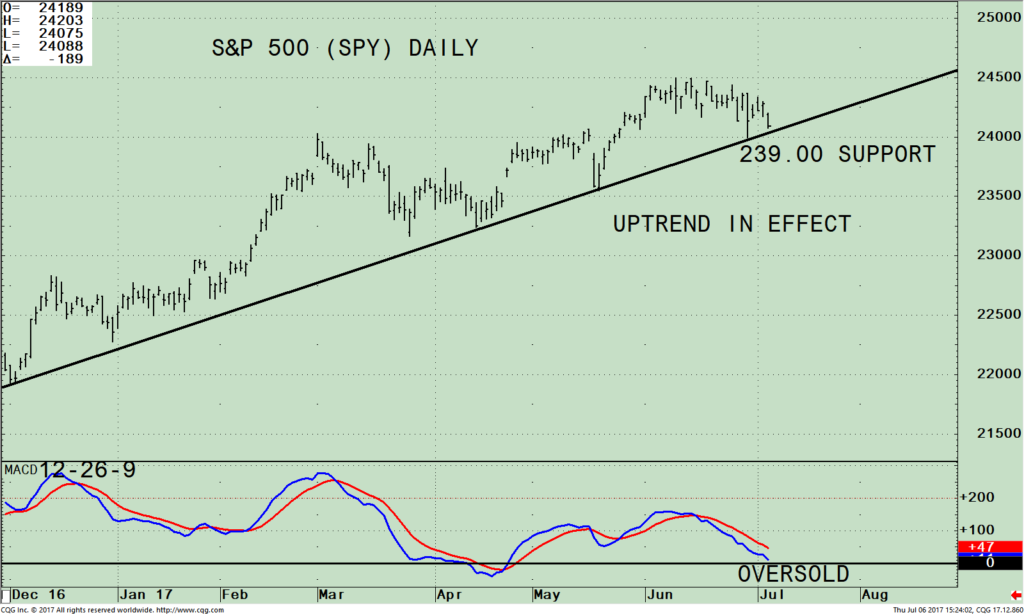 The S&P 500 (SPY) has been in a very strong daily uptrend since December 2016 and has been up for 8 months in a row. Yet, the SPY is now very close to breaking the daily uptrend. Key support is at 239.00. Any daily close below 239.00 for two days would suggest the decline could accelerate further.
MACD has worked off its overbought condition without the SPY giving up much ground. It will still take a few days of sideways action, or a decline in the SPY for the MACD to be oversold and move into favorable position to support a rally.
Summing Up:
Technology has been the leader of the major averages this year. However, during the last few weeks technology has been under more selling pressure than the other major averages. Now other sectors of the market such as SPY, XLU, XLP, IWM and MDY ETFs are also looking suspect, because of bearish negative divergences in MACD that have formed. The Consumer Staples (XLP) and Utilities (XLU) weekly price uptrends have been broken. The Russell 2000 (IWM) and S&P Mid Cap 400 (MDY) remain in price uptrends, positive for now. A break below key support at 137.00 on the Russell 2000 (IWM) on the close would mean trouble ahead. In addition any daily close below 239.00 on the SPY for two days would suggest the decline could accelerate further. New buying is not advised at this time. Caution is recommended until the tape improves.
I would love to hear from you. Please call me at 516-829-6444 or email at bgortler@signalert.com to share your thoughts or ask me any questions you might have.
*******Article published by Bonnie Gortler in Systems and Forecasts July 7, 2017
Disclaimer: Although the information is made with a sincere effort for accuracy, it is not guaranteed that the information provided is a statement of fact. Nor can we guarantee the results of following any of the recommendations made herein. Readers are encouraged to meet with their own advisors to consider the suitability of investments for their own particular situations and for determination of their own risk levels. Past performance does not guarantee any future results
If you like this article, then you will love this!

Free Instant Access to Grow
Your Wealth and Well-Being
E-Book HERE
Disclaimer: Although the information is made with a sincere effort for accuracy, it is not guaranteed that the information provided is a statement of fact. Nor can we guarantee the results of following any of the recommendations made herein. Readers are encouraged to meet with their own advisors to consider the suitability of investments for their own particular situations and for determination of their own risk levels. Past performance does not guarantee any future results.


Create more wealth in your life
with these simple strategies.
As an added bonus you will also
receive BG’s Updates and Ezine

Discover how to quickly create more well-being in your life with these simple strategies.
As an added bonus you will also
receive BG’s Updates and Ezine

As an added bonus you will receive BG’s Updates and Ezine

All work listed on BonnieGortler.com is licensed under a Creative Commons Attribution - Noncommercial - No Derivative Works 3.0 Unported License.
