

Bonnie’s Market Update 4/12/24
04/14/2024
New record highs in price on the major averages such as the S&P 500 Index, Nasdaq Composite Index and Russell 2000 occurred in late July. The Dow Jones Industrial Average (DJIA) penetrated another round number, the 22,000 level. However, what is disturbing are technical indicators measuring momentum, such as MACD didn’t surpass its momentum highs from June. Fear has been on the rise as the CBOE Volatility Index (VIX), the stock market’s fear measure, spiked on the recent short term decline in August after many days of low volatility.
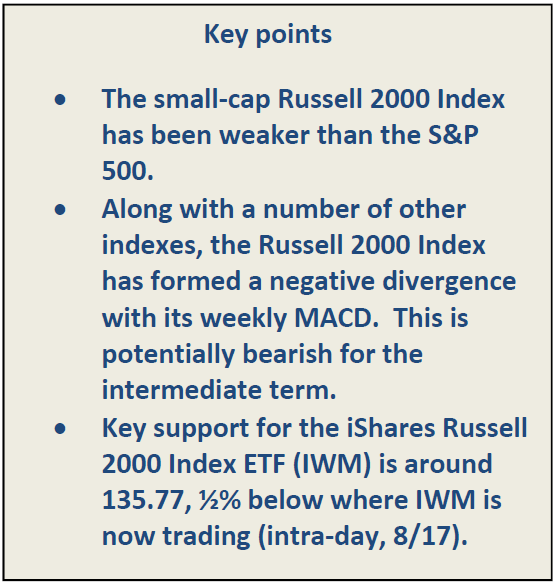
Our models remain overall neutral-positive, suggesting further gains are expected with downside risk remaining modest. Investors remain focused on many items including economic data for a possible December rate hike, a potential decrease in taxes, new health reform, and world events. Some investors remain on the sidelines waiting for more clarity, or on vacation taking some time off like me. The market was very quiet for over two weeks while I was gone and then last week, the tone of the market seemed to have changed. The market no longer was in a consolidation pattern. The S&P 500 index fell 1.4%, its worst week since March, while the Nasdaq lost 1.5%. The leader of the decline was small-cap stocks. The Russell 2000 index (IWM) fell last week 2.7%, its biggest one week decline since February 2016. It’s not a healthy sign when small caps are weaker than the overall market.
Watch the Movement Now of Small Caps Closely- iShares Russell 2000 ETF (IWM) Weekly Price (Top), and 12-26-9 Week MACD (Bottom)
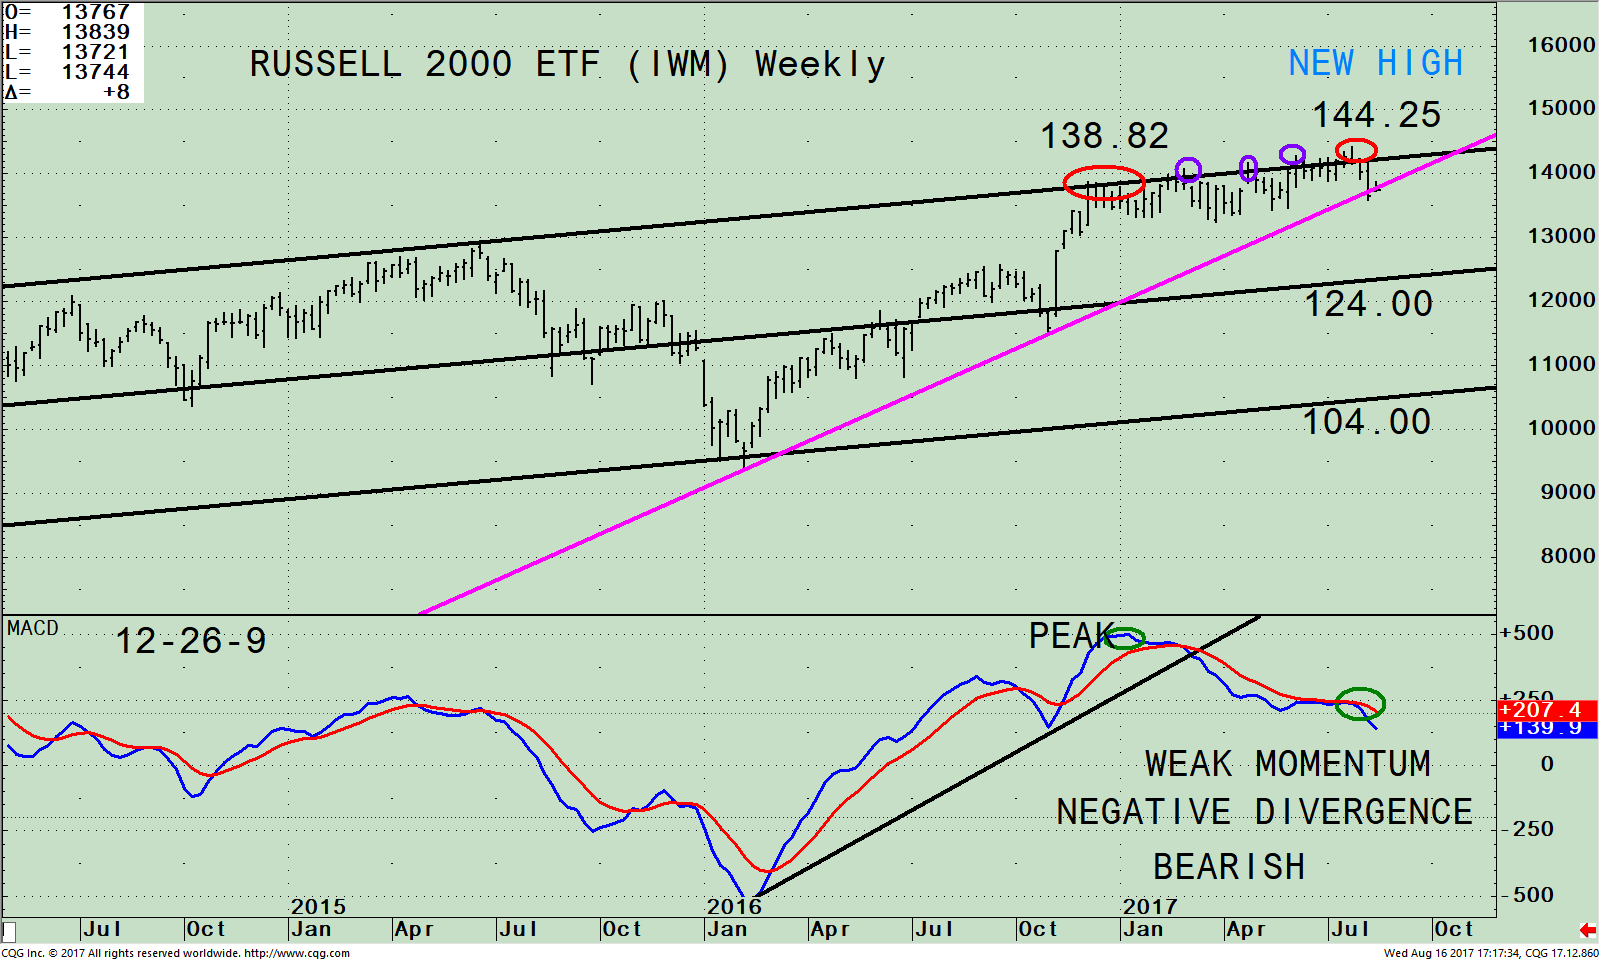
The top portion of the chart shows the weekly iShares Russell 2000 Index ETF (IWM) which is made up of companies with a market capitalization of between $300 million and $2 billion. The IWM made a high of 138.82 on 12/08/16 stopping at its upper channel. The IWM went sideways for about 8 weeks, not giving up much ground. The pattern of slightly higher highs continued followed by small pullbacks (purple circles). None of the pullbacks that occurred penetrated the uptrend that was in effect. This latest peak in July (red circle) failed again to penetrate the channel, and the uptrend is in jeopardy of being broken.
The lower portion of the chart is MACD, a technical indicator that measures momentum. MACD has an ugly looking pattern. Initially, MACD confirmed the price high in December 2016. On the following advances to new highs, MACD failed to confirm. Now momentum is clearly weakening and the formation is spread over 29 weeks. Usually, a divergence spread over time is a sign that the price may be reversing. Weakness in the Russell 2000 (IWM) below the low made on 08/07/17 at 135.77, would suggest last week’s decline may continue. If violated on a closing basis expect the IWM to fall to the next support level at 132.40 the 03/27/17 low and potentially to the weekly channel objective at 124.00.
Summing Up:
The market remains very resilient in 2017 with major averages continuing to make new all-time highs. Small caps have been unable to break out through its upper channel and on the latest decline, they led the market lower, not a healthy sign for the market. Pullbacks have been rare this year, turning into buying opportunities. With the IWM intermediate momentum pattern clearly weakening, forming a negative divergence spread over 29 weeks, now is not the time to take on additional risk in small caps bottom fishing on any pullback.
*******Article published by Bonnie Gortler in Systems and Forecasts August 17, 2017

If you like this article, then you will love this!
Free Instant Access to Grow
Your Wealth and Well-Being E-Book HERE
Disclaimer: Although the information is made with a sincere effort for accuracy, it is not guaranteed that the information provided is a statement of fact. Nor can we guarantee the results of following any of the recommendations made herein. Readers are encouraged to meet with their own advisors to consider the suitability of investments for their own particular situations and for determination of their own risk levels. Past performance does not guarantee any future results.


Create more wealth in your life
with these simple strategies.
As an added bonus you will also
receive BG’s Updates and Ezine

Discover how to quickly create more well-being in your life with these simple strategies.
As an added bonus you will also
receive BG’s Updates and Ezine

As an added bonus you will receive BG’s Updates and Ezine

All work listed on BonnieGortler.com is licensed under a Creative Commons Attribution - Noncommercial - No Derivative Works 3.0 Unported License.
