

Bonnie’s Market Update 4/12/24
04/14/2024
Historically September has not been favorable for stocks, with the S&P 500 declining a majority of the time. But surprisingly this September the major averages are near or at new highs, positive for the month. The major averages didn’t give up much ground after the Fed meeting and political concerns overseas. The Federal Reserve left interest rates unchanged but implied they would increase interest rates one more time by year-end, despite low inflation. There was a noticeable shift that took place as investors took profits rotating out of some of the leading sectors this year such as Technology and Utilities, and moved into sectors that were lagging. Energy, Industrials, and Financials were the big winners.
The bullish case remains for the overall market. Our equity timing models remain overall on a “hold” suggesting further gains are likely with risk contained. The advance decline line of the New York Stock Exchange Index and Transportation average has confirmed the major average highs suggesting a market top is unlikely. The iShares Russell 2000 Index (IWM) ETF is trending higher leading the advance, a healthy sign for the market. However, there are some sectors showing a loss of upside momentum, which means stock and sector selection will be more important going into the fourth quarter and early next year.
Health Care (XLV), a leader so far this year might have hit its peak.
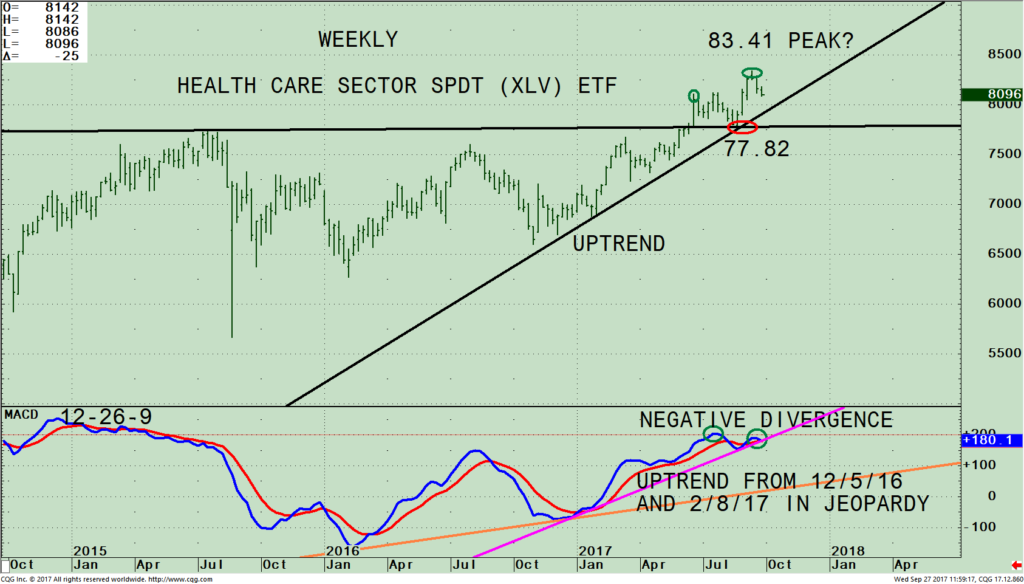
Figure: Health Care Select Sector SPDR ETF (XLV, top and MACD 12-26-9 (bottom)
The top portion of the chart above is the weekly Health Care SPDR (XLV) that is comprised of companies from industry groups including pharmaceuticals; health care providers & services; health care equipment & supplies; biotechnology; life sciences tools & services; and health care technology. As of 09/25/17, the top 5 holdings in the XLV were Johnson and Johnson (JNJ) 11.26%, Pfizer (PFE) 6.78%, United Health Group (UNH) 5.98%, Merck (MRK) 5.70%, and AbbVie Inc. (ABBV) 4.41%, totaling 34.13%. Except for a few short term declines, Healthcare (XLV) in 2017 has trended higher and is up 18.00% through 09/26/17, outperforming the S&P 500.
The biggest holding, Johnson and Johnson (JNJ) has been trending down. MACD is on a sell along with a bearish negative divergence. JNJ has broken its uptrend from January 2017 (chart not shown).
Notice in the top chart, how the XLV made a new high in July, breaking through its old high, but stalled immediately. A few weeks later the XLV pulled back to 77.82 (red circle) successfully testing its breakout then rising for three weeks to make a new high at 83.41. It’s encouraging the XLV uptrend remains in effect from February 2017. However, in the last two weeks, investors have shifted away from healthcare and some short term selling pressure has begun.
The bottom half of the chart shows MACD, a measure of momentum. MACD is on a sell and the MACD pattern is suggesting a possible peak for the short term in healthcare (XLV). MACD is above 0, rolling over with a double top, forming a negative divergence (a higher high in price but a lower high in MACD, (green circles).
The moment of truth is here. There are two significant uptrend lines in jeopardy if the XLV continues to decline. The uptrend from 02/08/17 would be broken (pink line) on any further weakness. However, the longer term uptrend in MACD from 12/5/16 remains intact (orange line).
In Sum: Healthcare has had a substantial rise. Declining momentum patterns are appearing signaling some weakness might lie ahead. Keep an eye if the XLV breaks below support at 77.82 on a weekly close. Now is not a good time to be over invested in health care. Caution is warranted, the party could be coming to an end soon.
More evidence: A potential shift away from Health Care (XLV) in the short term.
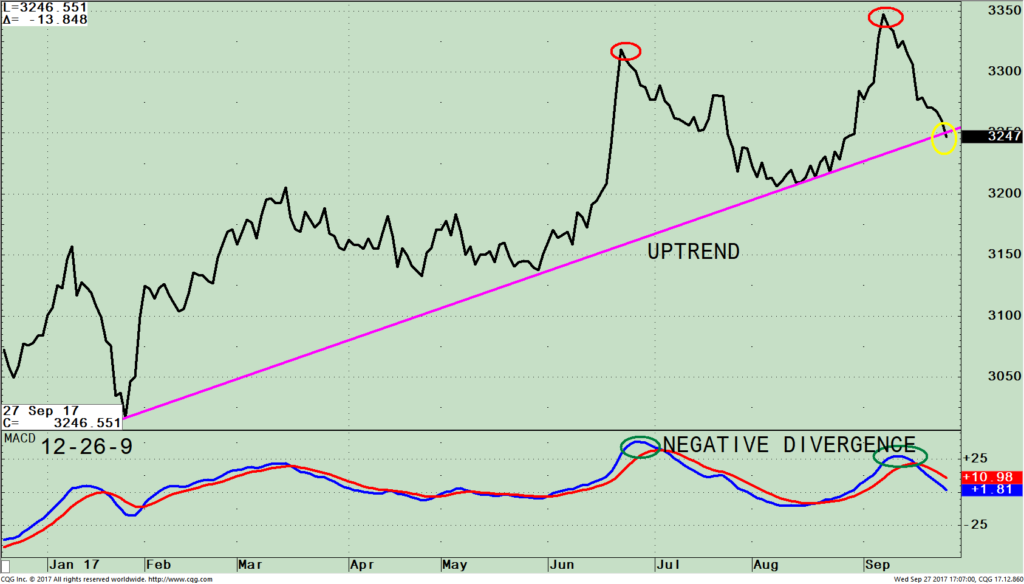
Figure: Daily (XLV) / (SPY) Ratio (Top); MACD of XLV/SPY Ratio (Bottom)
The chart above is the daily Health Care Select Sector SPDR ETF/ S&P 500 ratio XLV/SPY. A rising line means the XLV is stronger, and if falling, the S&P 500 is stronger. The XLV/SPY ratio has been in an uptrend since January 2017. Since the peak on September 8, 2017, the XLV/SPY ratio has turned down, giving a warning of deteriorating momentum in comparison to the S&P 500 (SPY). The uptrend was broken today.
The bottom half of the chart shows the 12-26-9 MACD, on the XLV/SPY ratio. MACD recently generated a sell, turning down from an overbought condition. Notice the negative divergence in the MACD pattern. MACD formed a lower high than the peak in June (green circles) while the XLV/SPY ratio in the top chart made a high, (red circles) suggesting a shift in trend has started and more weakness in XLV is expected compared to S&P 500.
I am recommending you review your holdings, making sure you are not over weight in health care.
Summing Up:
The stock market advance continued through September, one of the weakest months historically. Investors appear to be rotating out of some of the leading sectors starting with Nasdaq early in September. Health care, (XLV) one of the strongest sectors of the market this year, is giving warning signals of weakening momentum compared to the S&P 500 (SPY), suggesting it too might hit a bump in the road. I recommend reviewing your portfolio and reducing your healthcare exposure. If Healthcare (XLV) breaks below 77.82, on a weekly close this would trigger further selling.
I would love to hear from you. Please call me at 516-829-6444 or email at bgortler@signalert.com to share your thoughts or ask me any questions you might have.
Sign up for a FREE 3 issue trial of Click Here:The Systems & Forecasts Newsletter
*******Article published by Bonnie Gortler in Systems and Forecasts September 28, 2017
Disclaimer: Although the information is made with a sincere effort for accuracy, it is not guaranteed that the information provided is a statement of fact. Nor can we guarantee the results of following any of the recommendations made herein. Readers are encouraged to meet with their own advisors to consider the suitability of investments for their own particular situations and for determination of their own risk levels. Past performance does not guarantee any future results.


Create more wealth in your life
with these simple strategies.
As an added bonus you will also
receive BG’s Updates and Ezine

Discover how to quickly create more well-being in your life with these simple strategies.
As an added bonus you will also
receive BG’s Updates and Ezine

As an added bonus you will receive BG’s Updates and Ezine

All work listed on BonnieGortler.com is licensed under a Creative Commons Attribution - Noncommercial - No Derivative Works 3.0 Unported License.
