

5 Investing Strategies to Save Money and Grow Wealth
04/11/2024
An amazing run for the stock market continues. Record highs, new winning streaks of consecutive gains for the major averages, low volatility, and no fear have been this year’s story. May-October, with September the worst month, has historically been a weak period for the stock market but this year profits were made.
What to expect now?
Although there have been warnings of weakening momentum patterns, no serious decline materialized. The present tape action suggests there are no signs of a market top. The technical picture of the market remains positive, with short term price up trends and support levels intact. Market breadth indicators are positive, the advance/decline line has made new highs and in a few weeks favorable seasonality will begin.
The bulls remain in control until proven otherwise. Until a trend change appears or more warning signs in the tape occur, we are likely to higher prices in the months ahead. Financials regained their spark. Overseas markets are outperforming the U.S. market, especially emerging markets. It’s also bullish that small and mid-cap stocks have rebounded after some short term weakness. The same pattern looks to be happening in the technology sector. A shift has occurred. Prices have firmed, weakness in technology stocks appears over, momentum patterns are improving, and higher prices are imminent.
Technology could now be ready to lead again.
Figure: PowerShares QQQ ETF (Nasdaq 100 Index) Daily Price and Trend Channel (Top), and MACD 12-26-9 (Bottom)
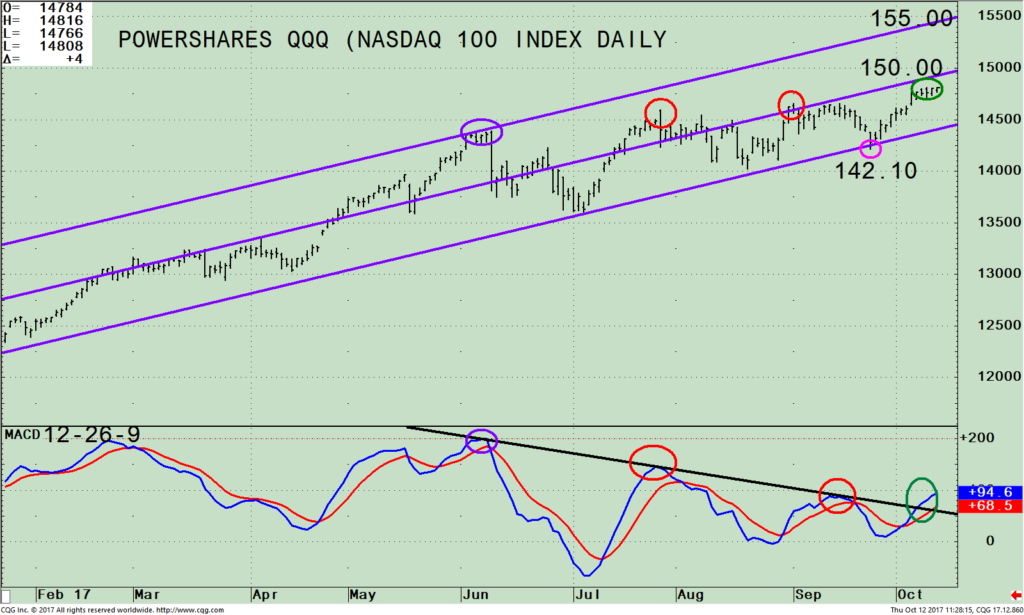
The top part of the chart shows the daily Power Shares 100 (QQQ), an exchange-traded fund based on the Nasdaq 100 Index and its operative trend channel. The QQQ includes 100 of the largest domestic and international nonfinancial companies listed on the Nasdaq stock market based on market capitalization. As of 10/10/17, Apple, (AAPL) is the largest holding comprising 11.50%, Alphabet Inc. 9.11% (Class C, GOOG, and Class A, GOOGL combined), Microsoft Corp (MSFT) 8.45%, Amazon.com, Inc. (AMZN) 6.82%, and Facebook, Inc. Class A (FB) 5.85%,.
The rally in technology stalled in July and September (red circles) failing to generate enough momentum to reach the upper channel as it did in early June (purple circle). However, the intermediate trend remains up for technology (QQQ).
The decline in the QQQ was contained holding the lower channel. However, in the last two weeks the QQQ rallied to near the middle channel (green), closing today at 148.02, consolidating under key resistance at 150.00. A break above 150.00 would imply further gains to at least 155.00 and possibly as high as 173.00. As long as the QQQ remains above the September low at 142.10, the trend is up and higher prices are likely.
The bottom half of the chart is MACD (12, 26, 9), a measure of momentum. MACD just missed going below 0 before its recent turn up, a promising MACD pattern. The downtrend from June has been broken (black line). MACD is showing strength, very close to surpassing its September peak breaking the pattern of lower highs. MACD is signifying an increase in momentum as well as giving an advanced warning of a potential advance.
The near term is bullish for top Holdings of QQQ
Figure: Daily Price of Microsoft (MSFT), Amazon (AMZN), Facebook, (FB) Apple (AAPL), and 12-26-9 Daily MACD
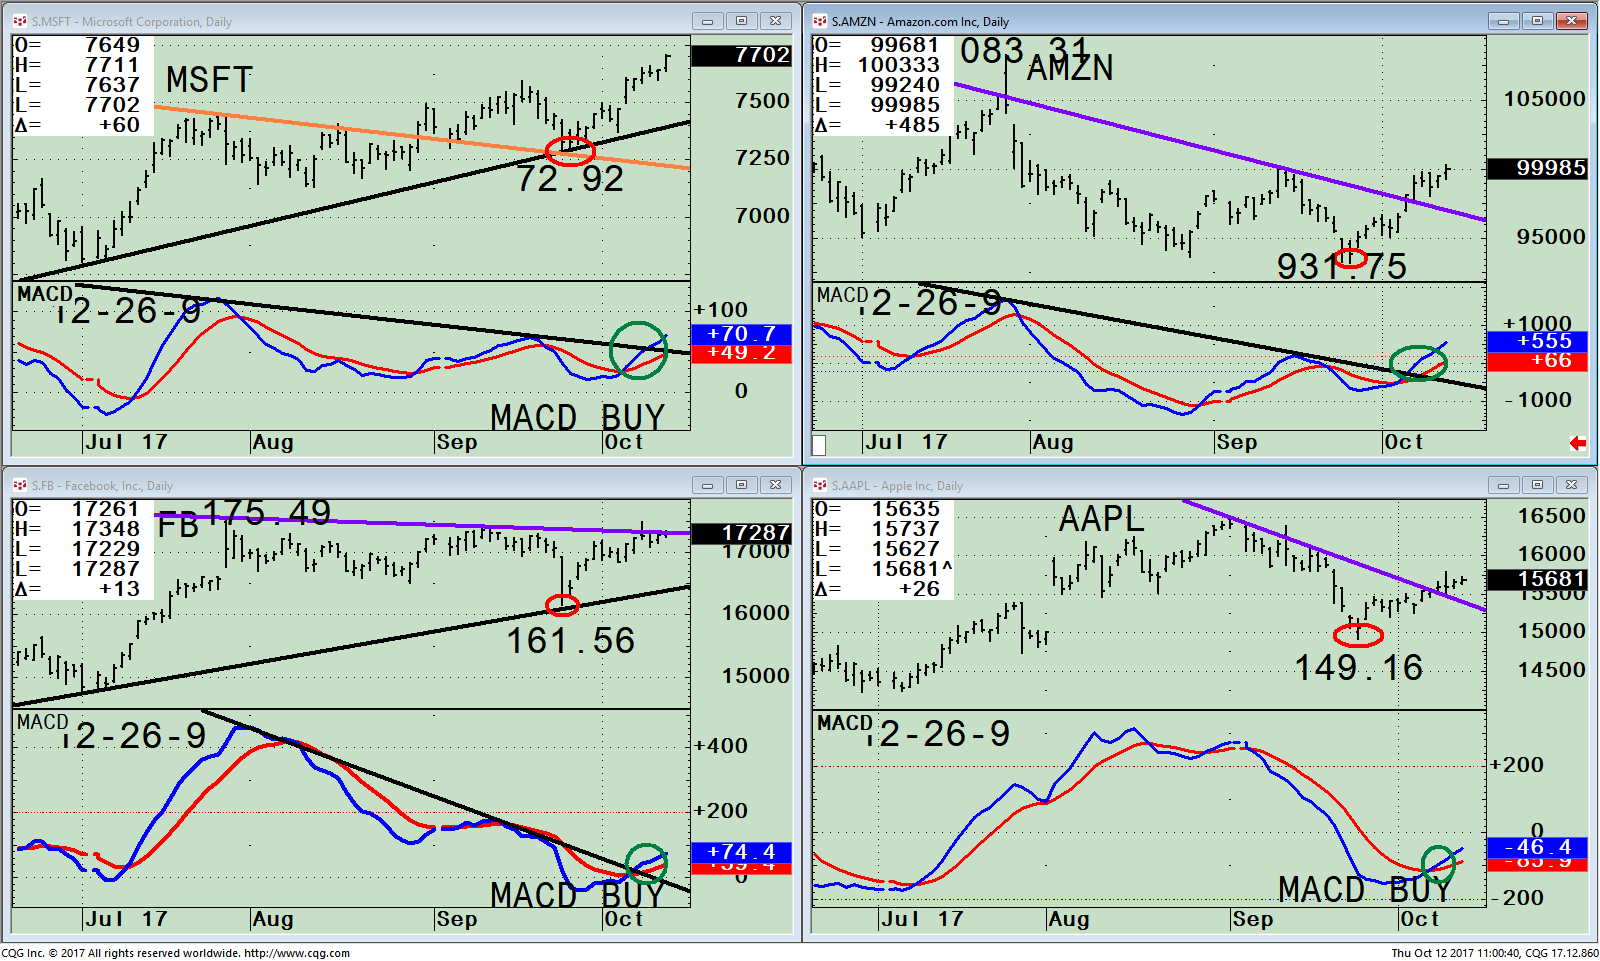
In the near term technology stocks look higher. Favorable MACD patterns exist on Microsoft (MSFT), Amazon (AMZN), Facebook, (FB) and Apple (AAPL). If the top holdings in the QQQ remain strong, and hold above support, further gains for the overall market are likely too. I recommend watching the performance of the top holdings in the QQQ over the next several days-weeks for further clues in market direction. For aggressive investors and traders here are some key levels for guidance.
Microsoft (MSFT), one of the strongest top holdings of the QQQ has already made a new high. MSFT has successfully tested its August breakout. Support is at 72.92. Resistance is at 77.00. Upside objective is at 80.00.
Facebook (FB), remains in an uptrend from July and is trading near its highs. Resistance is 175.49. Upside objective is at 186.00. Support is at 161.56.
Amazon (AMZN) broke its short term down trend from July. Resistance is at 1003.00 followed by 1050.00 and 1083.00. Support is at 931.75.
Apple (AAPL) made a new all-time high in August at 164.80 and then fell out of favor with investors, pulling back to 149.16. This week Apple broke its short term down trend from August. Support is at 150.00. Resistance is at 165.00. Upside objective is at 175.00.
The lower portion of each chart shows the technical indicator MACD, a measure of momentum. MACD has generated a buy for all 4 stocks Microsoft (MSFT), Amazon (AMZN), Facebook, (FB) and Apple (AAPL), These MACD buys are considered bullish for the near term and confirms the positive shift in trend from down to up.
Summing Up:
The major averages are near or at their highs. The tape action suggests there are no signs of an impending market top now or in the near future. The trend remains up. Unfavorable seasonality will turn favorable in a few weeks which I believe will bode well for the balance of the year. Favorable MACD patterns exist on Microsoft (MSFT), Amazon (AMZN), Facebook, (FB) and Apple (AAPL) in the near term. If the top holdings in the QQQ remain strong, and hold above support, further gains for the overall market are likely to continue to trend higher.
I would love to hear from you. Please call me at 516-829-6444 or email at bgortler@signalert.com to share your thoughts or ask me any questions you might have.
Sign up for a FREE 3 issue trial of Click Here:The Systems & Forecasts Newsletter
*******Article published by Bonnie Gortler in Systems and Forecasts September 28, 2017
Disclaimer: Although the information is made with a sincere effort for accuracy, it is not guaranteed that the information provided is a statement of fact. Nor can we guarantee the results of following any of the recommendations made herein. Readers are encouraged to meet with their own advisors to consider the suitability of investments for their own particular situations and for determination of their own risk levels. Past performance does not guarantee any future results.


Create more wealth in your life
with these simple strategies.
As an added bonus you will also
receive BG’s Updates and Ezine

Discover how to quickly create more well-being in your life with these simple strategies.
As an added bonus you will also
receive BG’s Updates and Ezine

As an added bonus you will receive BG’s Updates and Ezine

All work listed on BonnieGortler.com is licensed under a Creative Commons Attribution - Noncommercial - No Derivative Works 3.0 Unported License.
