

5 Investing Strategies to Save Money and Grow Wealth
04/11/2024
Who would have thought the major average averages would be in a steady uptrend since late August? There has been no decline of more than 3% on the S&P 500 index as the market climbs the wall of worry to record highs. Short term price uptrends and support levels remain intact in the major averages.
The Russell 2000 (IWM) has been in a consolidating pattern since October 4. Several times the IWM has tried to break out to the upside. However, it’s a bit worrisome the latest rally attempt failed this week. Also a point of concern, investor sentiment is showing very high optimism. In the past, at these levels short-term declines have started. On the other hand, the Volatility Index (VIX) that measures fear is near its lows, a positive sign, and favorable seasonality has begun.
Watch the Movement of Small Caps Closely
Weakness in the Russell 2000 (IWM) or sudden weakness in Technology stocks (QQQ) would be a sign a short term pullback is likely. A bullish sign would be if the Russell 2000 (IWM) index were to stop its present decline, reverse and take out the highs made on November 1. In addition, if the Russell 2000 (IWM) could outperform the S&P 500 (SPY), new 52-week highs begin to expand, and volume increases on up days, while new 52-week lows contract, this would be positive for the market.
The iShares Russell 2000 Index (IWM) Weekly Price Channel, Upside Objective Channel, and 19-26-9 Week MACD
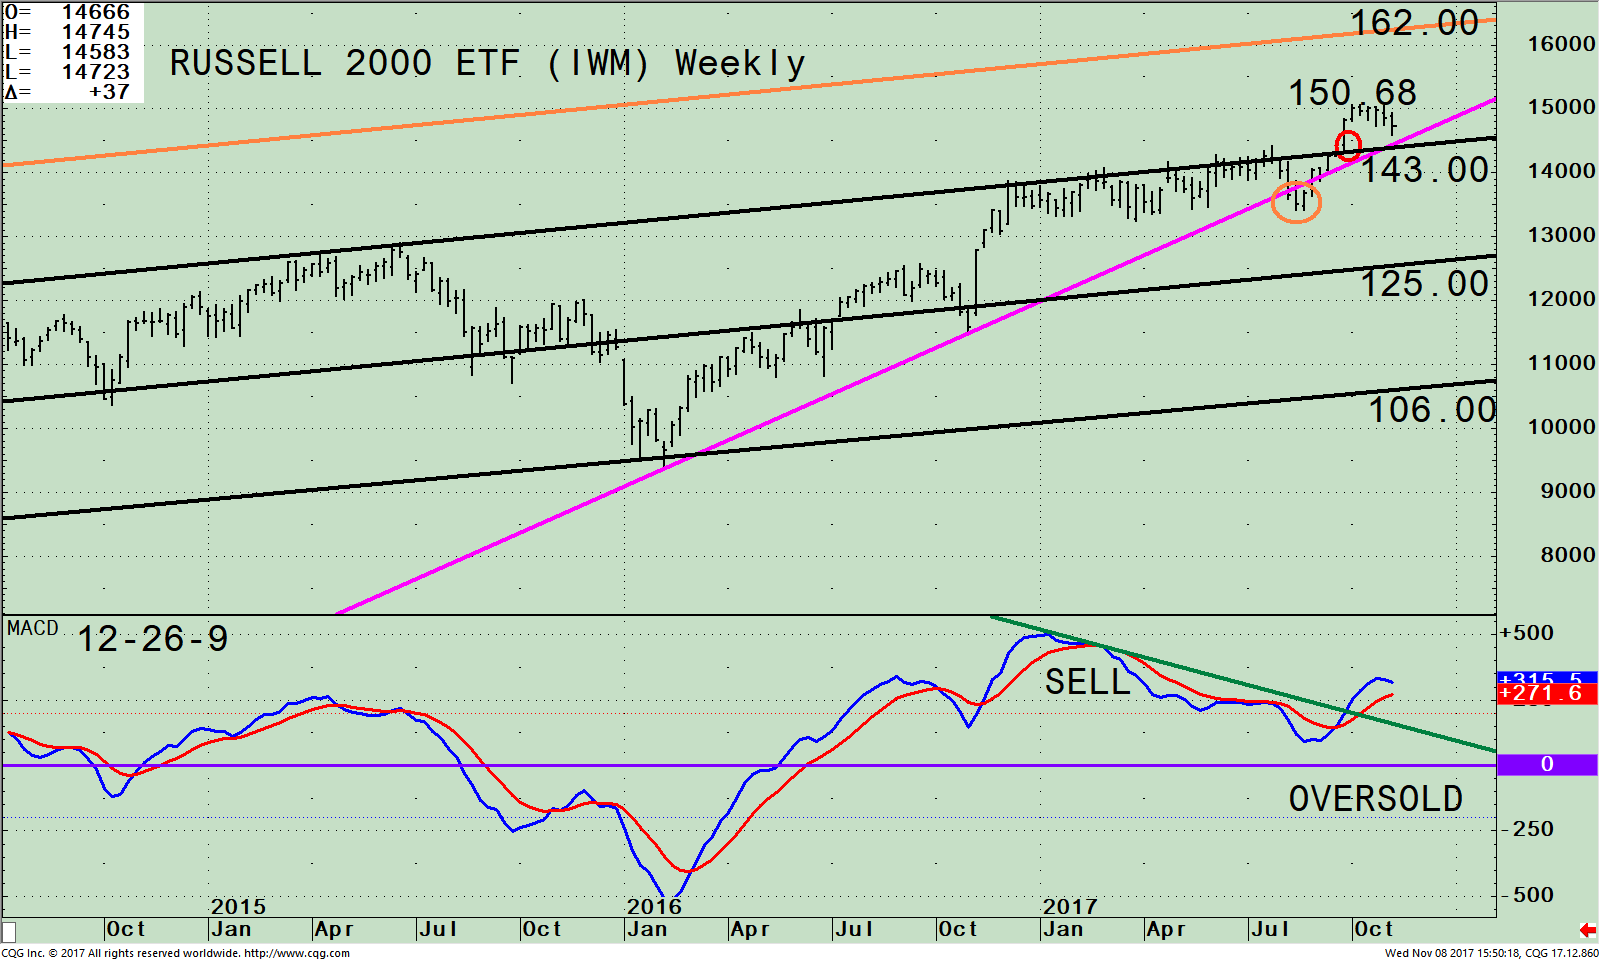
The top portion of the chart shows the weekly iShares Russell 2000 Index ETF (IWM) which is made up of companies with a market capitalization of between $300 million and $2 billion. The IWM made a high of 150.68 on 10/09/17, breaking out above its upper channel. A consolidation followed with the IWM confined in a tight trading range, but has since turned down. Even so, IWM is holding above an important support area.
The good news is during the short-term decline, the IWM remains above the weekly uptrend (pink line) while the other major averages are holding their ground.
The lower portion of the chart is MACD, a technical indicator that measures momentum. MACD peaked in January 2017, confirming the price high. The MACD sell turned out to be premature. The IWM consolidated while MACD weakened but didn’t get oversold, and go below 0. In September MACD turned up, broke the down trend (black line) not confirming the October high, and is now starting to roll over, showing a sign of a loss of momentum. It’s a little early to know if MACD will continue to decline or if MACD will turn up and have enough strength to make a new momentum high.
The Russell 2000 (IWM) support is at 143.00. Resistance is at the old highs at 150.68 with an upside objective of 162.00.
Summing Up:
With our models in the most favorable condition and favorable seasonality, I am looking for the short term decline in the IWM to reverse and at least challenge the old highs at 150.69 and potentially reach the upper channel at 162.00. If the IWM were to close below the lows made on 08/18/17 at 134.12 (circled in orange), this would negate my bullish view.
Intermediate Uptrend Continues In Technology Despite Slowdown in Momentum
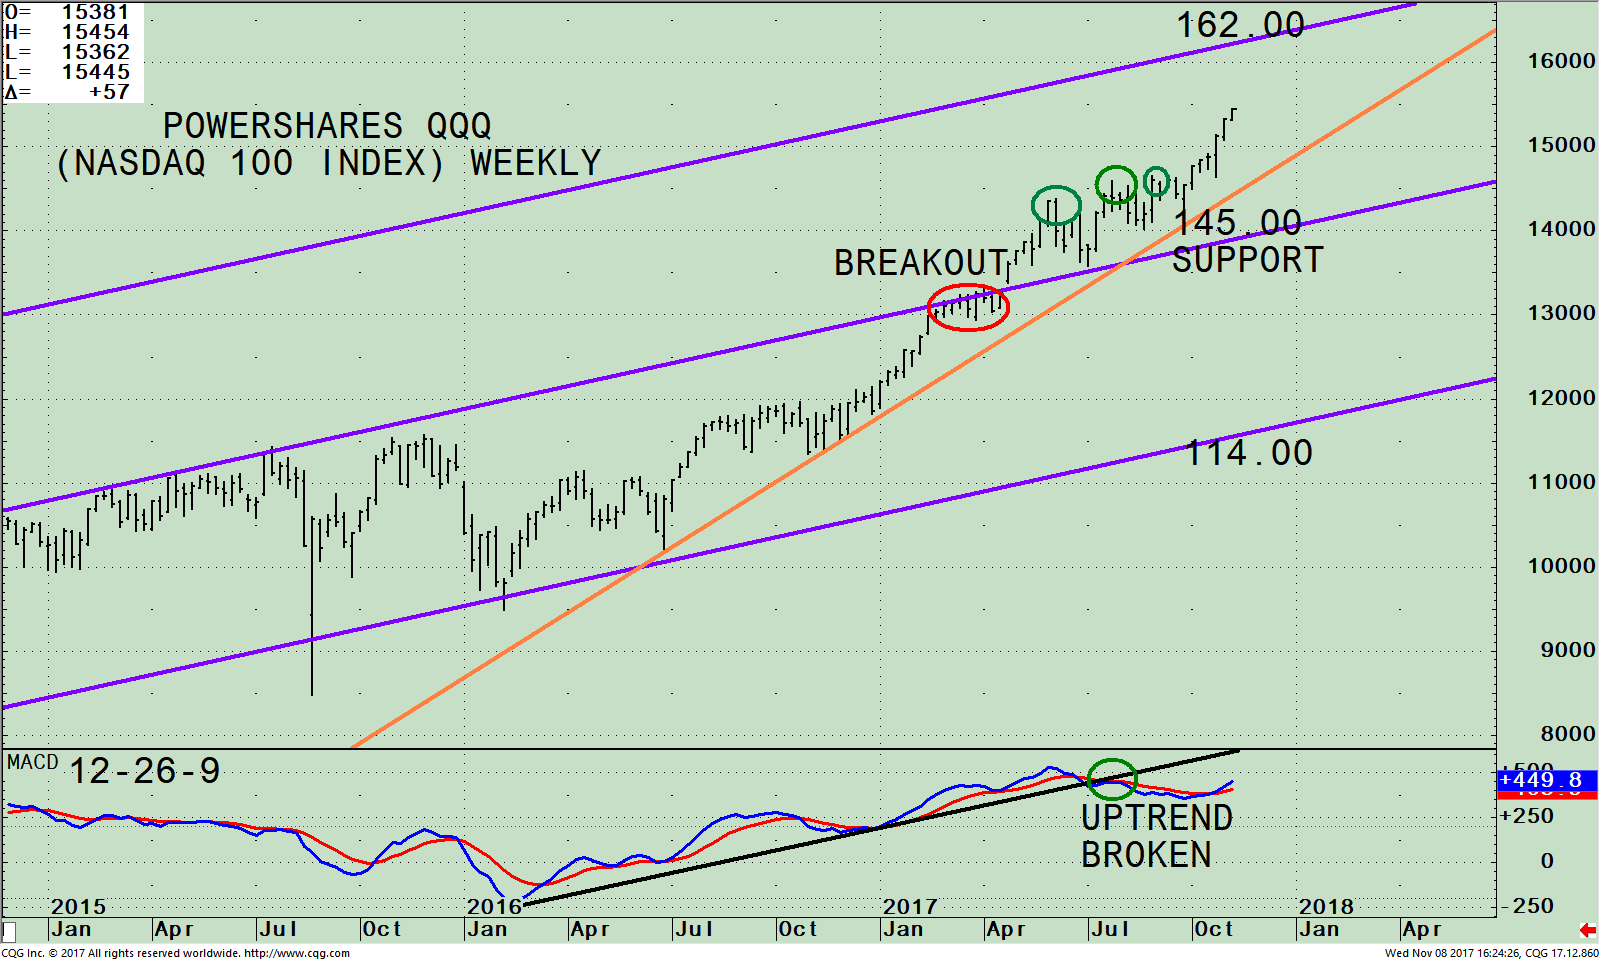
PowerShares QQQ ETF (Nasdaq 100 Index) Weekly Price and Trend Channels (Top), and MACD 12-26-9 (Bottom)
The top part of the chart shows the weekly Power Shares 100 (QQQ), an exchange-traded fund based on the Nasdaq 100 Index, and its operative trend channel (purple line).
The QQQ includes 100 of the largest domestic and international nonfinancial companies listed on the Nasdaq stock market based on market capitalization. As of 11/7/17, Apple, (AAPL) is the largest holding comprising 12.47%, Microsoft Corp (MSFT) 8.96%, Amazon.com, Inc. (AMZN) 7.45%, Facebook, Inc. Class A (FB) 5.90%, Alphabet Inc. Class C (GOOG) 4.96%, and Alphabet Inc. Class A (GOOGL), 4.33 % totaling 44.07%.
The QQQ breached the middle channel after a 9-week consolidation (red circle) on 04/24/17 and continues to make new highs with only small pullbacks along the way. The intermediate price trend remains up as long as the QQQ is above its uptrend line (orange). Support is at 145.00 and the upside channel objective at 162.00. If the QQQ falls below 145.00, on a weekly close, (an unlikely event), this would change the intermediate trend from up to down, implying weakness potentially to the lower channel at 116.00.
The bottom half of the chart is MACD (12, 26, 9), a measure of momentum. There has been no MACD confirmation of the highs made in QQQ as it did in June. However, it is a positive sign MACD has turned up, after the negative divergence in MACD (green circles) and the uptrend is broken. I recommend keeping an eye on the top holdings in the QQQ over the next several weeks for an advanced warning of a trend change.
In Sum:
Technology continues to be in favor, outperforming the S&P 500. As long as the QQQ is above 145.00 on a weekly close (orange line), more gains are likely toward the upper channel objective at 162.00. Our models are positive and price uptrends are intact so there is a good reason to expect a year-end rally. Be aware of a short term decline to start if small caps remain weaker than the S&P 500, the top holdings in the QQQ begin to falter, and the uptrends are violated. However, the trend is your friend. Continue to enjoy the ride.
I would love to hear from you. Please call me at 516-829-6444 or email at bgortler@signalert.com to share your thoughts or ask me any questions you might have.
Sign up for a FREE 3 issue trial of Click Here: The Systems & Forecasts Newsletter
*******Article published by Bonnie Gortler in Systems and Forecasts November 9, 2017
Disclaimer: Although the information is made with a sincere effort for accuracy, it is not guaranteed that the information provided is a statement of fact. Nor can we guarantee the results of following any of the recommendations made herein. Readers are encouraged to meet with their own advisors to consider the suitability of investments for their own particular situations and for determination of their own risk levels. Past performance does not guarantee any future results.


Create more wealth in your life
with these simple strategies.
As an added bonus you will also
receive BG’s Updates and Ezine

Discover how to quickly create more well-being in your life with these simple strategies.
As an added bonus you will also
receive BG’s Updates and Ezine

As an added bonus you will receive BG’s Updates and Ezine

All work listed on BonnieGortler.com is licensed under a Creative Commons Attribution - Noncommercial - No Derivative Works 3.0 Unported License.
