

5 Investing Strategies to Save Money and Grow Wealth
04/11/2024
The stock market has had an explosive start in January with the S&P 500 (SPY) and the Nasdaq 100 (QQQ) completing their upside objectives at 276.00 and 164.00 respectively. These are now levels of support if the market were to decline.
What to Watch Now For Direction?
SPDR S&P Financial Select SPDR ETF (XLF) Daily Price (Top), and MACD 19-26-9 (Bottom)
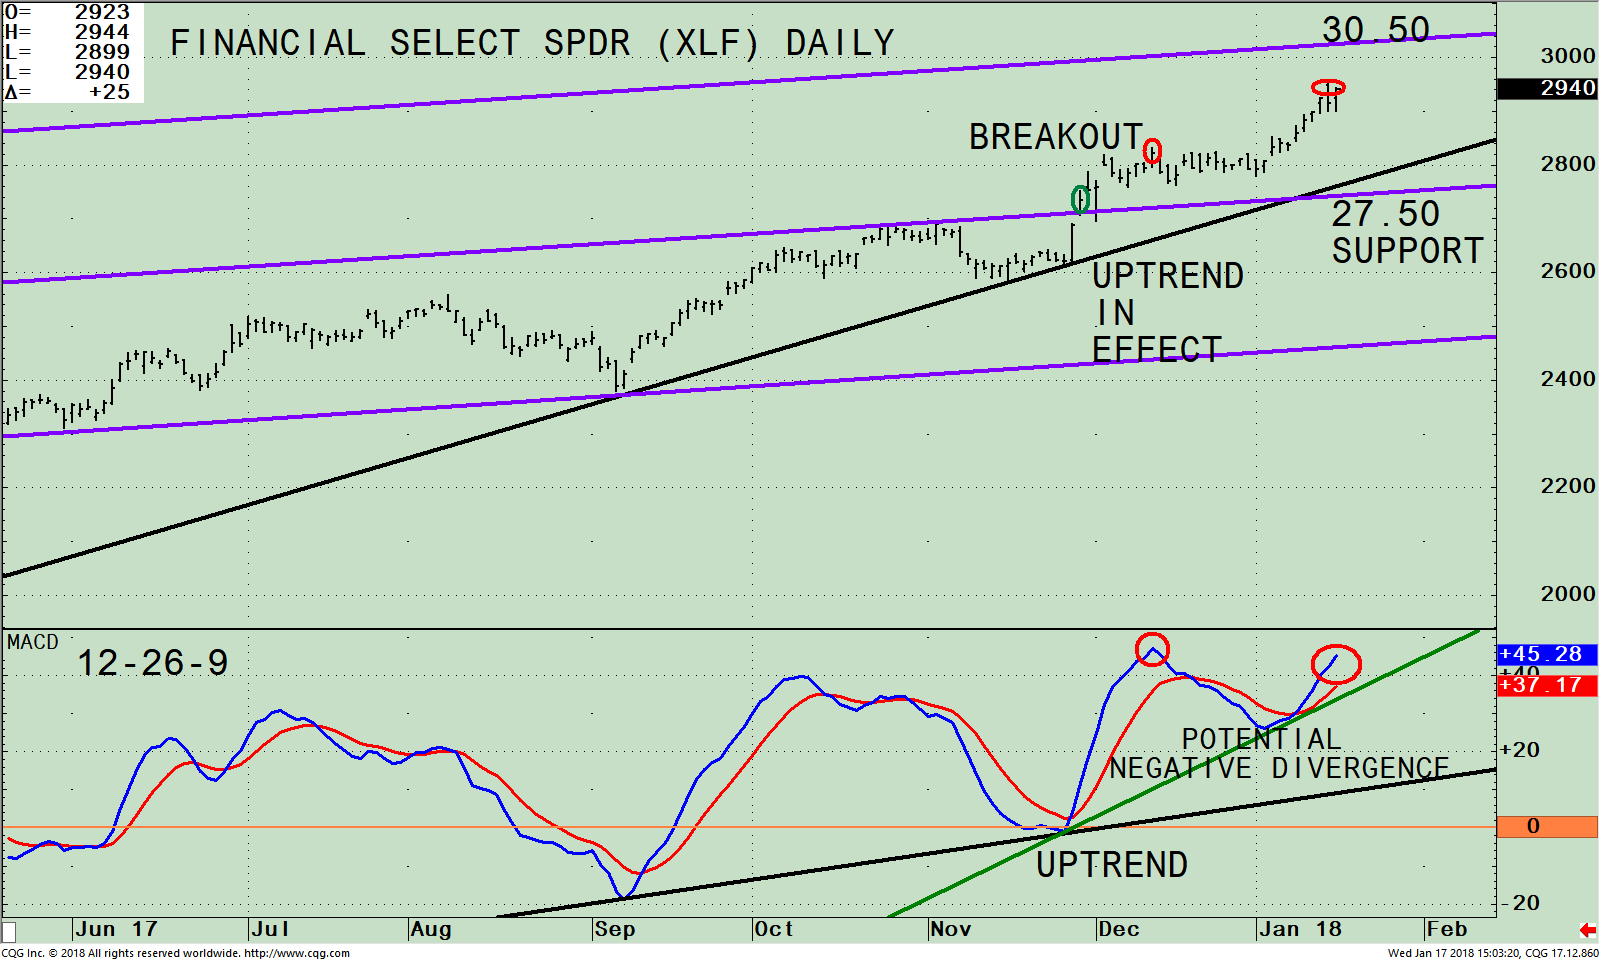
The top part of the chart shows the daily Financial Sector SPDR (XLF), an exchange traded-fund (ETF) that tracks a mix of diversified financial service firms, insurance, banks, capital markets, consumer finance and thrift companies. As of 01/217/18, the top holdings of XLF are Berkshire Hathaway B, (BRK.b) 11.50%, JP Morgan Chase & Co (JPM) 11.07%, Bank of America Corp (BAC) 8.61%, Wells Fargo & Co (WFC) 7.87%, and Citigroup Inc. (C), 5.79%. When financials are strong the S&P 500 (SPY) also tends to do well because the S&P 500 index has 14.85% of its holdings in the financial sector, second in weight only to the technology sector (at 23.96% as of 01/16/18).
Financial stocks made a low in September of 2017 and then stalled at the middle channel before breaking out in November 2017. The XLF then went sideways holding the middle channel. In the start of 2018 the XLF has come to life, up 5.41% outperforming the S&P 500 (SPY), (as of 01/17/18), a bullish sign. Historically, it’s a sign of a healthy market when financial stocks are strong; showing signs there is economic growth. The daily upside target is 30.50, now only 3.6% away. Support is at 27.50.
The bottom half of the chart is MACD (12, 26, 9) a technical indicator that measures momentum. MACD is rising, a positive sign. Keep an eye out for a potential break in the uptrend in MACD (green line). An MACD turndown now would not favorable because MACD would fail to confirm the price high and instead would form a negative divergence. This would be a warning the rally could be running out of steam.
The good news is the uptrend in MACD remains intact, and if the rise in MACD continues then MACD will confirm the XLF high. A break above 30.50 on a closing basis would give higher upside targets to 33.50 coinciding with the weekly upside objective. (See chart below).
SPDR S&P Financial Select SPDR ETF (XLF) Weekly Price (Top), and MACD 19-26-9 (Bottom)
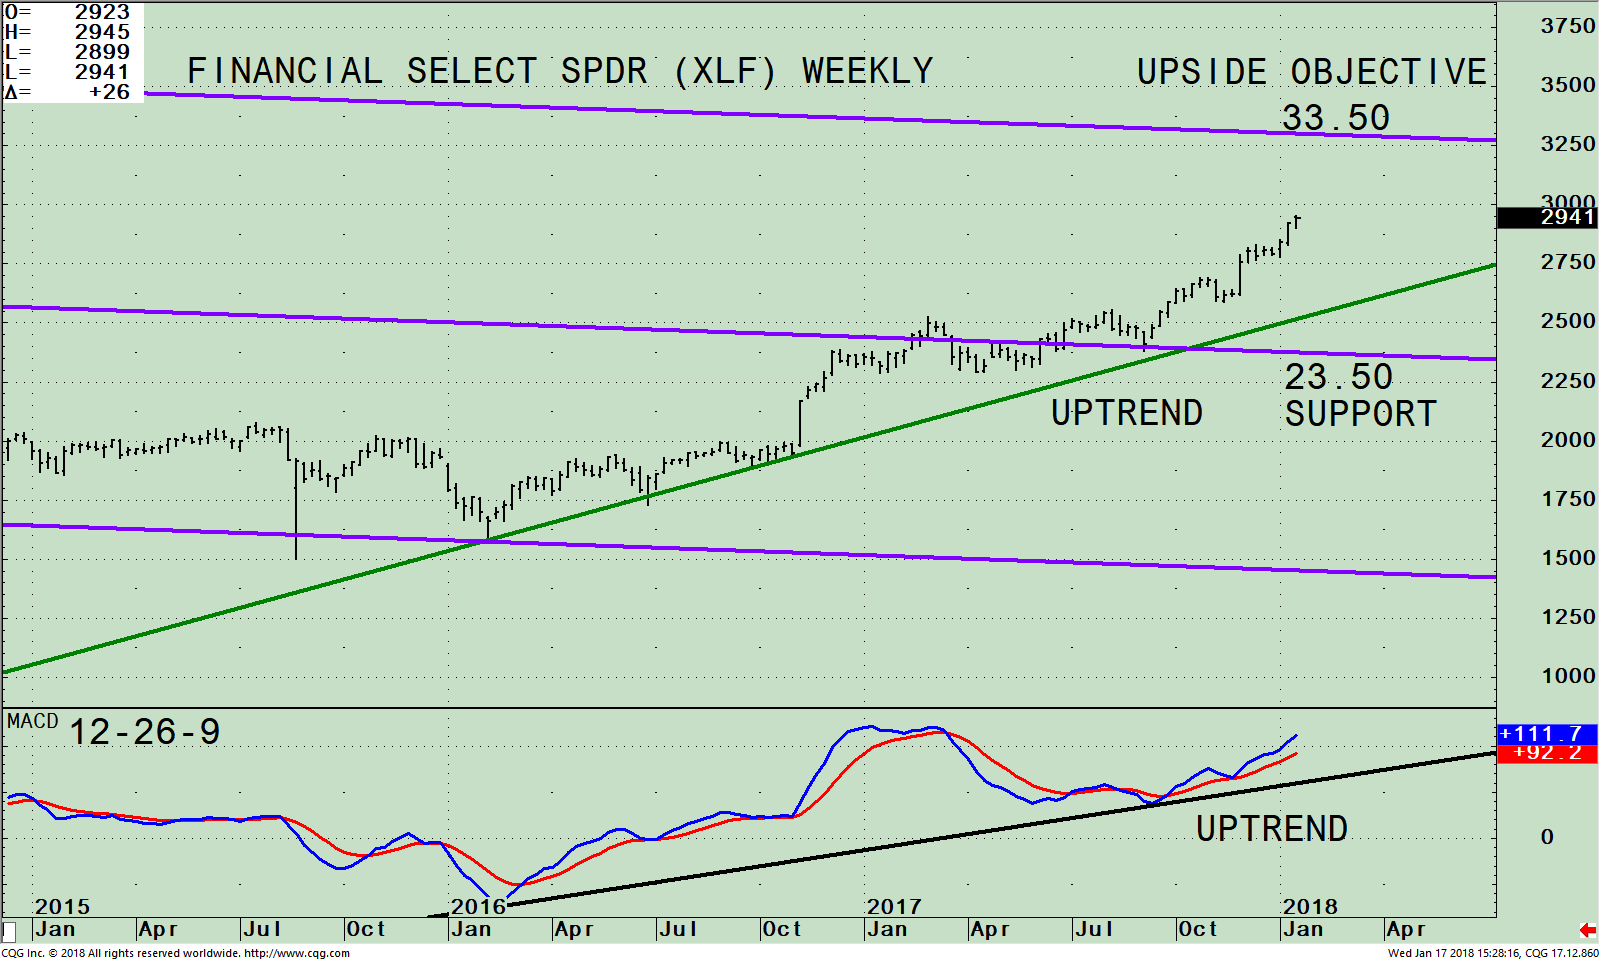
The top part of the chart shows the weekly Financial Sector SPDR (XLF). The XLF has been in a steady intermediate uptrend since 2016. The upside objective is 33.50, 13.9% higher from today’s close at 29.41. Support is at 23.50. MACD in the lower portion of the chart is still rising and its uptrend also remains in effect. Therefore, the likelihood is for the XLF to continue to rise.
Just to Sum Up:
Stocks have started 2018 with a bang. Our U.S. equity timing model remains on its October 31st buy, a condition where historically risk has been below average and returns above average. The financial sector has been one of the leaders of the advance, which is a sign of a healthy market. If the XLF closes above 30.50 then the next higher upside target would be 33.50. As long as the XLF stays above 27.50 further gains in the financial sector are likely.
I would love to hear from you. Please call me at 516-829-6444 or email at bgortler@signalert.com to share your thoughts or ask me any questions you might have.
Sign up for a FREE 3 issue trial of
SYSTEMS AND FORECASTS Click HERE
*******Article published by Bonnie Gortler in Systems and Forecasts January 18, 2018
Disclaimer: Although the information is made with a sincere effort for accuracy, it is not guaranteed that the information provided is a statement of fact. Nor can we guarantee the results of following any of the recommendations made herein. Readers are encouraged to meet with their own advisors to consider the suitability of investments for their own particular situations and for determination of their own risk levels. Past performance does not guarantee any future results.


Create more wealth in your life
with these simple strategies.
As an added bonus you will also
receive BG’s Updates and Ezine

Discover how to quickly create more well-being in your life with these simple strategies.
As an added bonus you will also
receive BG’s Updates and Ezine

As an added bonus you will receive BG’s Updates and Ezine

All work listed on BonnieGortler.com is licensed under a Creative Commons Attribution - Noncommercial - No Derivative Works 3.0 Unported License.
