

5 Investing Strategies to Save Money and Grow Wealth
04/11/2024
February was a month to remember. The short-term correction (-10%) that loomed over the market finally arrived in the major averages. After new highs in January, now there is weakness in the tape appearing more regularly. Volatility has more than doubled based on the Volatility Index (VIX). There has been a clear loss of momentum in some technical indicators that are starting to appear. Sometimes in the past, a precursor to lower stock prices down the road.
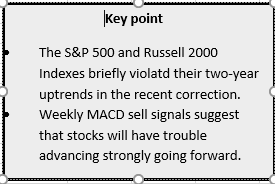
Our U.S. equity timing model remains on its October 31st buy. This is normally a condition where historically risk has been below average and returns above average. So far, the correction has been contained. With the latest decline, the short term is oversold from where potential rallies do develop. However, the intermediate term charts are the opposite, they are overbought, suggesting the likelihood the market could have some difficulty having a substantial rise.
Keep a close eye on the movement in the Russell 2000 Index (IWM), a good measure for the broad market.
Figure: The iShares Russell 2000 Index (IWM) Weekly Price Channel and Upside Objective, and 19-26-9 Week MACD
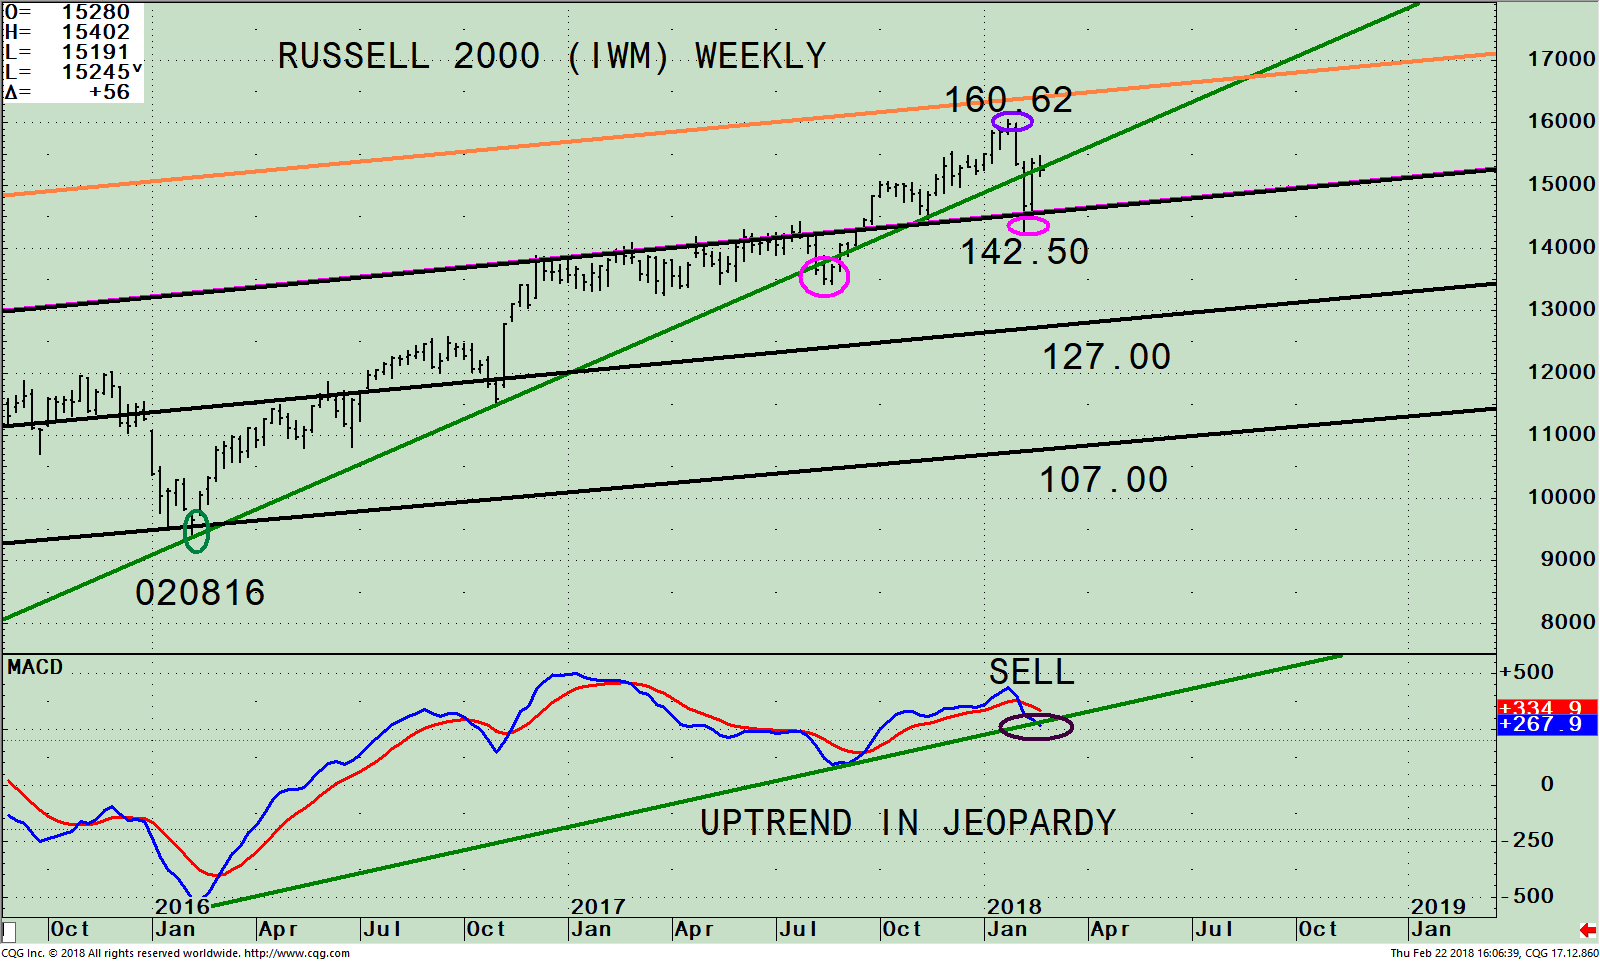
The iShares Russell 2000 Index ETF (IWM) is made up of companies with a market capitalization of between $300 million and $2 billion. The Russell 2000 (IWM) portfolio top sector holdings as of 02/21/18, is Financials 17.71%, Technology 16.61%, Health Care 15.13%, Industrials 14.58% and Consumer Cyclicals 12.23. (Side note): Weekly MACD of Financials (XLF) has just given a fresh sell which is the top sector of the Russell 2000 Index
The top portion of the chart shows the weekly Russell 2000 Index (IWM) peaking at 160.62 on 1/24/18, failing to reach the equidistant channel objective (orange line) at 164.00 (purple circle). The IWM then turned down penetrating the uptrend (green line) that began in February 2016. This was the second time the uptrend was slightly violated, also in August 2017 (pink circles). After penetrating the uptrend line, both times the IWM reversed higher. This time could be a different story compared to the August 2017 rise when the IWM was moving sideways, much quieter, and the trading range was only about 1/2% a day. In this market climate, there is more volatility, intraday swings are between 1 and 2 %.
The lower portion of the chart is MACD, a technical indicator that measures momentum. MACD is in an overbought condition, momentum weakening, very close to generating a fresh sell signal. MACD is also threatening to break a two-year-old uptrend that began in January 2016. Risk is on the rise.
The SPDR S&P 500 (SPY) is also showing warning signs of a loss of momentum for the intermediate term.
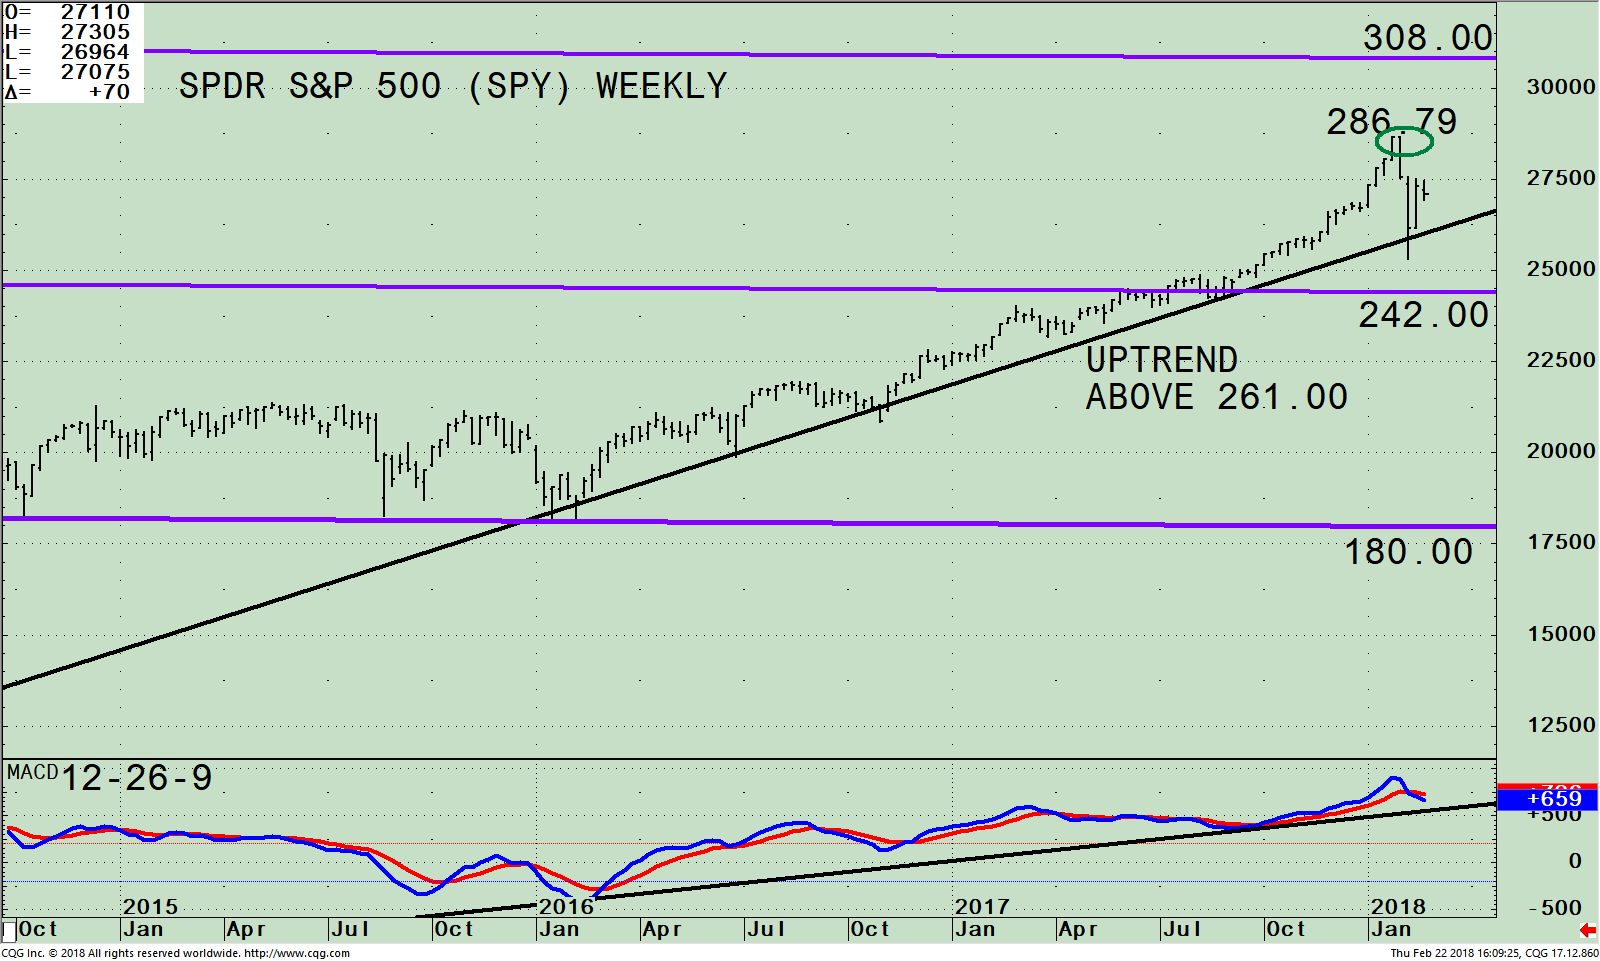
Figure: S&P 500 SPDR ETF Weekly Price Channel and upside objective (SPY, top) and 12-26-9 MACD (bottom)
The chart above is the weekly SPDR S&P 500 (SPY) ETF and its weekly (intermediate) price channel (purple lines). The S&P 500 (SPY) is made up of 500 stocks of the largest companies in the U.S. When you invest in the S&P 500 (SPY), you are getting a broad representation of large-cap U.S stocks with a moderate risk.
The S&P 500 (SPY) advance didn’t quite reach the upper channel objective at 308.00, peaking at 286.79. During February’s sharp and quick decline, the two-year uptrend was slightly penetrated to the downside. The SPY reversed sharply off its lows. However, as of the writing the rally has stalled and a tight trading range between 268.00 and 275.00 has developed. If the S&P closes below 268.00 the odds would increase a test of the lows is imminent.
MACD is in an overbought condition, very close to generating a sell signal along with breaking an uptrend from January 2016, over two years old. For now, the benefit of the doubt goes to the bulls. However, momentum is weakening. risk is on the rise, and caution is recommended
Summing Up:
The easy times are over. A clear loss of momentum in the market averages has occurred in February. Some technical damage did occur during the sharp decline in February. Although the market averages have reversed off their lows, there is a good chance a test of the lows will occur over the next few weeks. Intra-day volatility is on the rise which adds to risk. For now, the bulls remain in control. Even so, if you haven’t already you have a second chance to review your investment portfolio. Be ready for the potential challenges that may be ahead, and be prepared for the potential opportunities that may arise in months to come. If you need a second pair of eyes we are here to help you.
I would love to hear from you. Please call me at 516-829-6444 or email at bgortler@signalert.com to share your thoughts or ask me any questions you might have.
Sign up for a FREE 3 issue trial of
SYSTEMS AND FORECASTS Click HERE
******Article published by Bonnie Gortler in Systems and Forecasts February 23, 2018
Disclaimer: Although the information is made with a sincere effort for accuracy, it is not guaranteed that the information provided is a statement of fact. Nor can we guarantee the results of following any of the recommendations made herein. Readers are encouraged to meet with their own advisors to consider the suitability of investments for their own particular situations and for determination of their own risk levels. Past performance does not guarantee any future results.


Create more wealth in your life
with these simple strategies.
As an added bonus you will also
receive BG’s Updates and Ezine

Discover how to quickly create more well-being in your life with these simple strategies.
As an added bonus you will also
receive BG’s Updates and Ezine

As an added bonus you will receive BG’s Updates and Ezine

All work listed on BonnieGortler.com is licensed under a Creative Commons Attribution - Noncommercial - No Derivative Works 3.0 Unported License.
