

10 Simple Tips for Financial Well-Being
07/01/2026
The major averages, Dow, S&P 500, and Nasdaq were in a consolidation phase within a low volatility environment. However, in recent weeks intra-day volatility has picked due to concern about tax reform. When the S&P 500 (SPY) is down 0.5% in one day, it gets your attention, especially since there have been many daily changes of no more than .38% on the up or downside. This leads me to believe it’s only a matter of time before daily trading ranges will begin to widen. However, with support levels holding and the intermediate and long trends favorable, the odds favor the bulls.
After weeks of consecutive gains, there was some weakness in the tape, along with a loss of momentum in some technical indicators. Losses for the major averages were minor and much more forgiving than compared to individual stocks. Many stocks this quarter fell 5% or more and sometimes double digits, especially after earnings misses or modest projections of future sales or earnings.
I continue to believe the Russell 2000 Index (IWM) is a clue to signaling the trend of the overall market.
During the last few weeks, the Russell 2000 (IWM) had been losing momentum, weaker than the Dow, S&P 500, and the Nasdaq, not even able to break the hourly downtrend. However, a shift in relative strength in favor of the Russell 2000 over the S&P 500 started on 11/16/17, and the Russell 2000 (IWM) is now leading the advance. This is overall bullish.
Figure: Daily iShares Russell 2000 Index (IWM)/S&P 500 Index (SPY) Ratio (top) and 12-26-9 MACD Ratio (bottom)
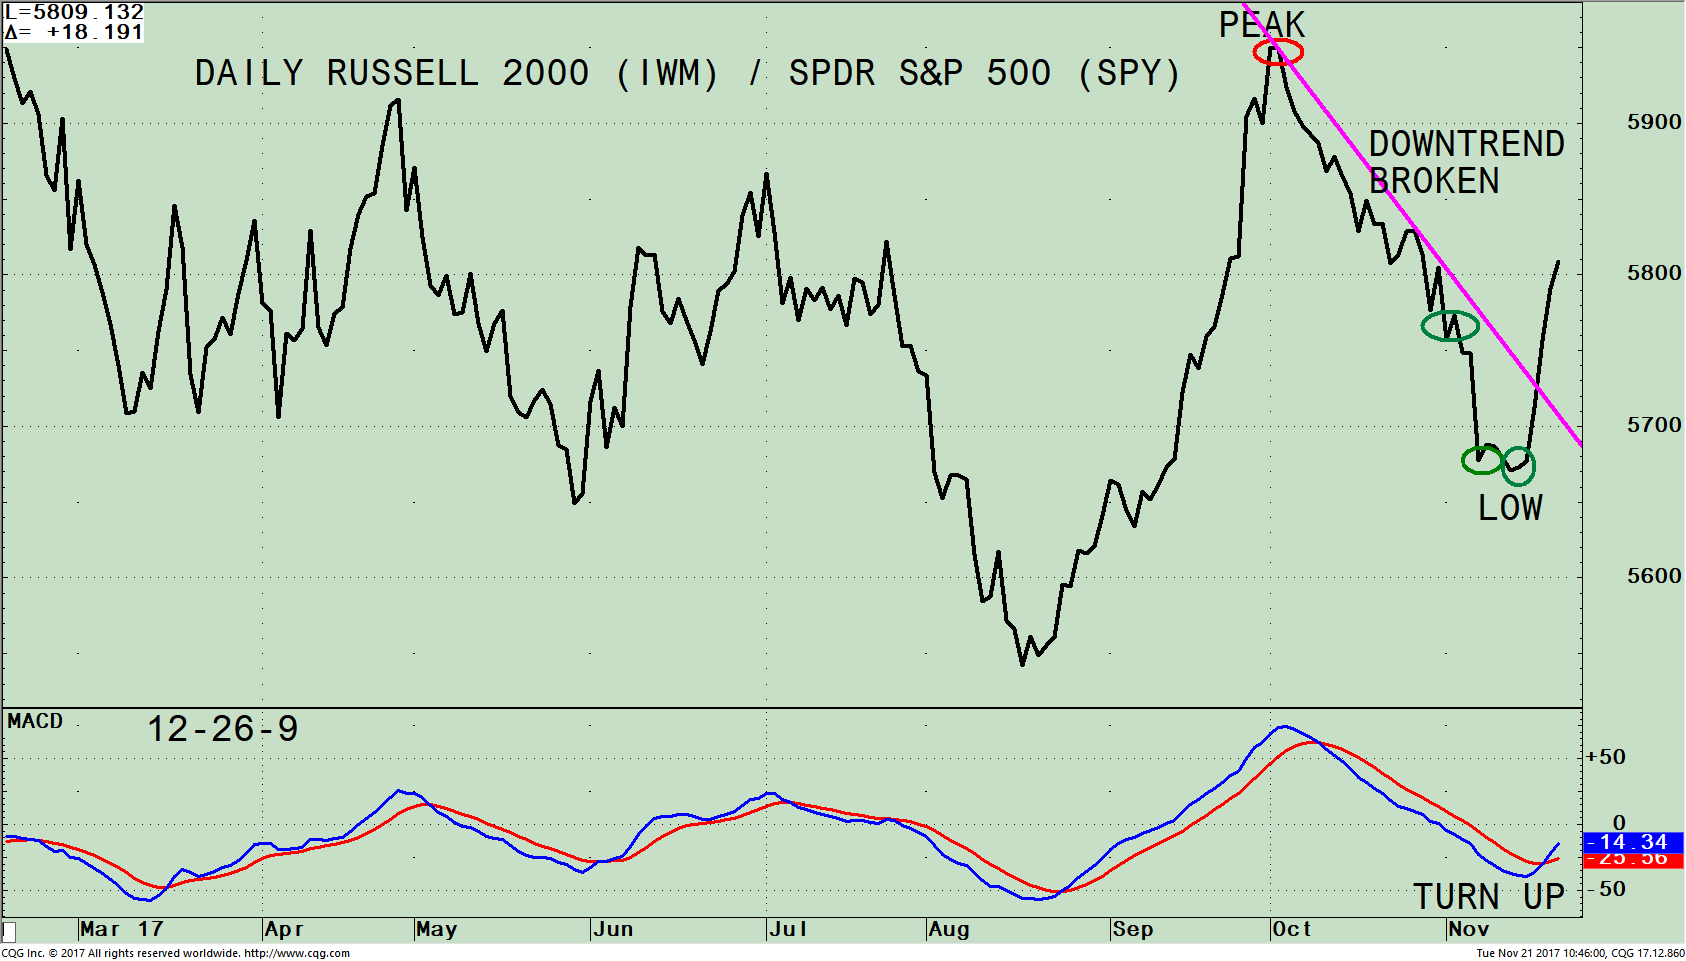
The top part of the chart on page 5 is the daily Russell 2000 Index / S&P 500 Index ratio (IWM/SPY). A rising line means the IWM is stronger, and if falling, the SPY is stronger. After outperforming the S&P 500 (SPY) from the August lows, the IWM/SPY ratio peaked on 10/02/17. Since then, the IWM/SPY ratio had been trending lower with a series of turn ups (green circles) that were unsuccessful as the IWM moved lower. However, the IWM has broken its downtrend (pink line), after forming a low, implying the IWM will resume its out performance like earlier in the year over the S&P 500 (SPY). This is a positive sign the next leg of the advance may have begun. It also aligns with the fact that historically small caps rally into year end.
In the unlikely event another failure takes place, and the IWM starts to lag, this would not be a good sign for the overall market.
The lower portion of the chart is the MACD of the IWM / SPY ratio. The IWM/SPY ratio MACD has been on a sell in a steady downtrend from its peak. However, it’s very positive that MACD has turned up generating a buy and confirming the price turn up in the IWM/SPY ratio (top chart). In addition, the daily MACD of the Russell 2000 (IWM, chart not shown) is oversold and has given a fresh MACD buy.
Figure: S&P 500 SPDR ETF Weekly Price Channel and upside objective (SPY, top) and 12-26-9 MACD (bottom)
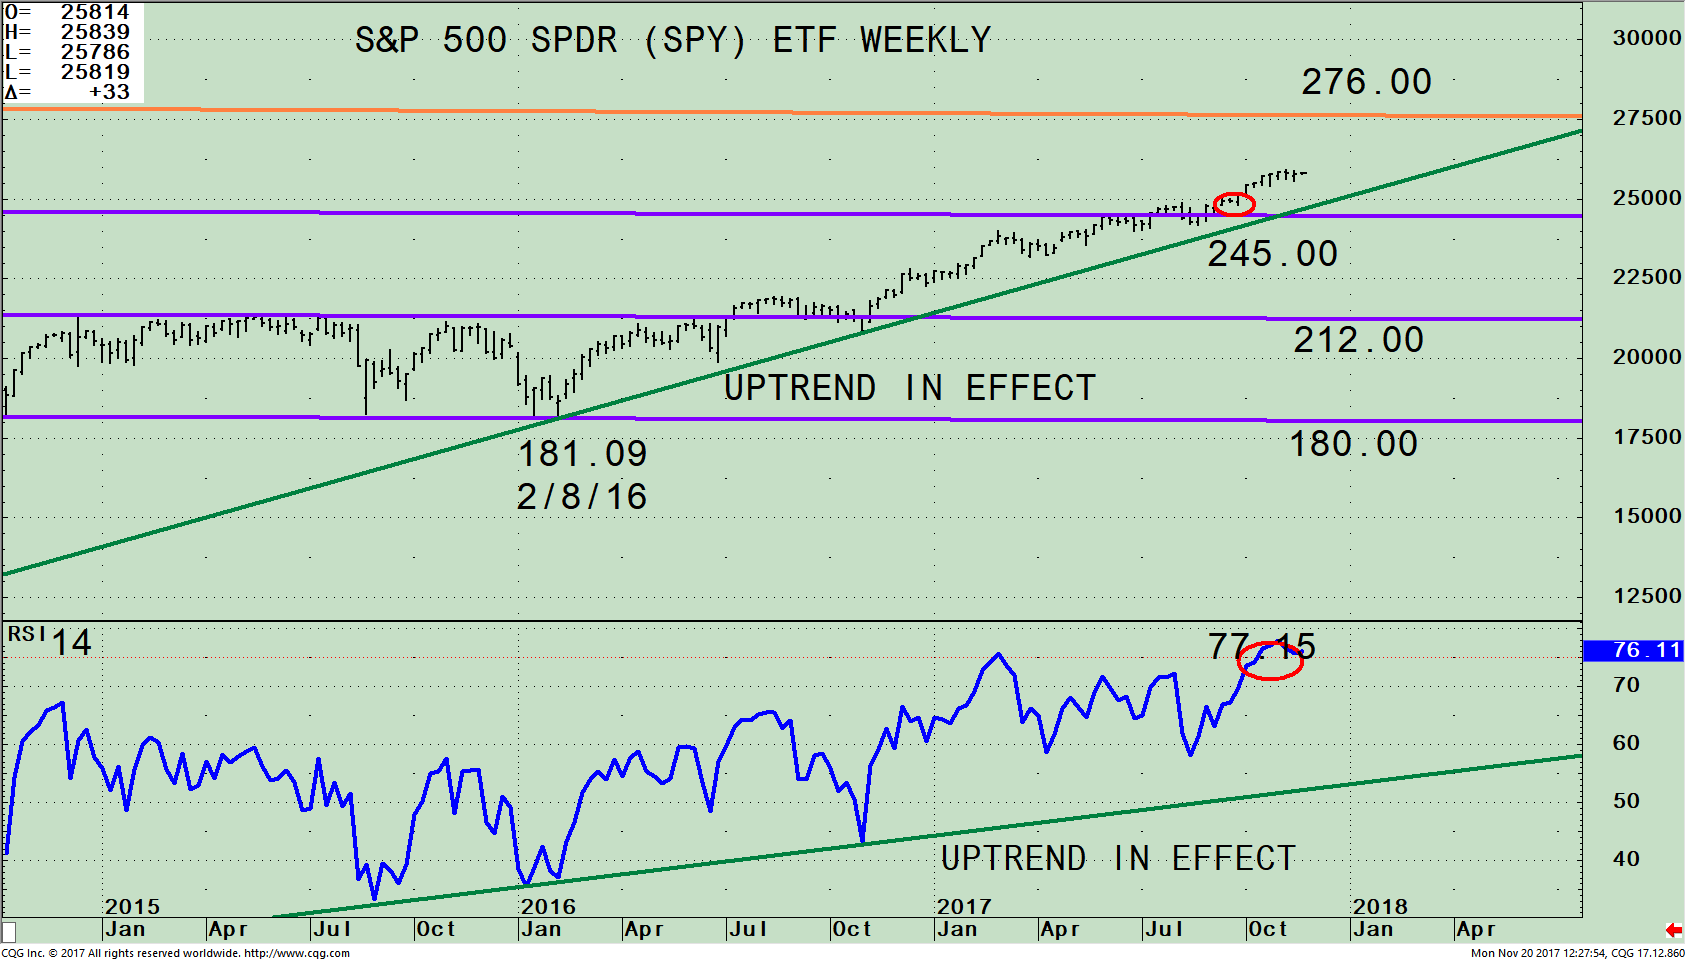
Key uptrend and intermediate support remains intact for the S&P 500 (SPY)
The chart above is the weekly SPDR S&P 500 (SPY) ETF and its weekly (intermediate) price channel (purple lines). The upside channel objective is 276.00 (orange line). The S&P 500 (SPY) is comprised of 500 stocks of the largest companies in the U.S. When you invest in the S&P 500 (SPY), you are getting a broad representation of large-cap U.S stocks with a moderate risk.
The SPY remains in an uptrend that began in February 2016 (green line). The declines this year in the SPY have been minor and brief. If the SPY falls below 245.00, the area where the SPY broke out of its most recent trading range, this would turn the intermediate trend negative and imply weakness towards the middle channel at 212.00. Until the upside trend line is broken, no serious threat of a major decline is likely.
The bottom half of the chart shows the Relative Strength Index, a measure of momentum developed by Welles Wilder. RSI is based on the ratio of upward price changes to downward price changes. RSI is 77.15 confirming the high made by the SPY. When RSI gets above 70 it’s a sign of underlying strength. It’s bullish the uptrend in RSI from 1/16/16 remains intact. Short-term weakness is perfectly normal after a large run-up in prices to alleviate the overbought condition. However, market tops rarely occur when RSI gets over 70- 75.
In Sum:
As long as the S&P 500 (SPY) uptrend remains in effect above 245.00, the SPY is likely to work its way higher toward the upper weekly channel at 276.00. If the downtrend is broken (green lines) on either price or RSI, a warning sign would be given for a potential change in trend and a short-term correction to begin.
Further evidence higher prices are likely.
Figure: S&P 500 SPDR ETF Monthly Price (SPY, top) and RSI 14 (bottom)
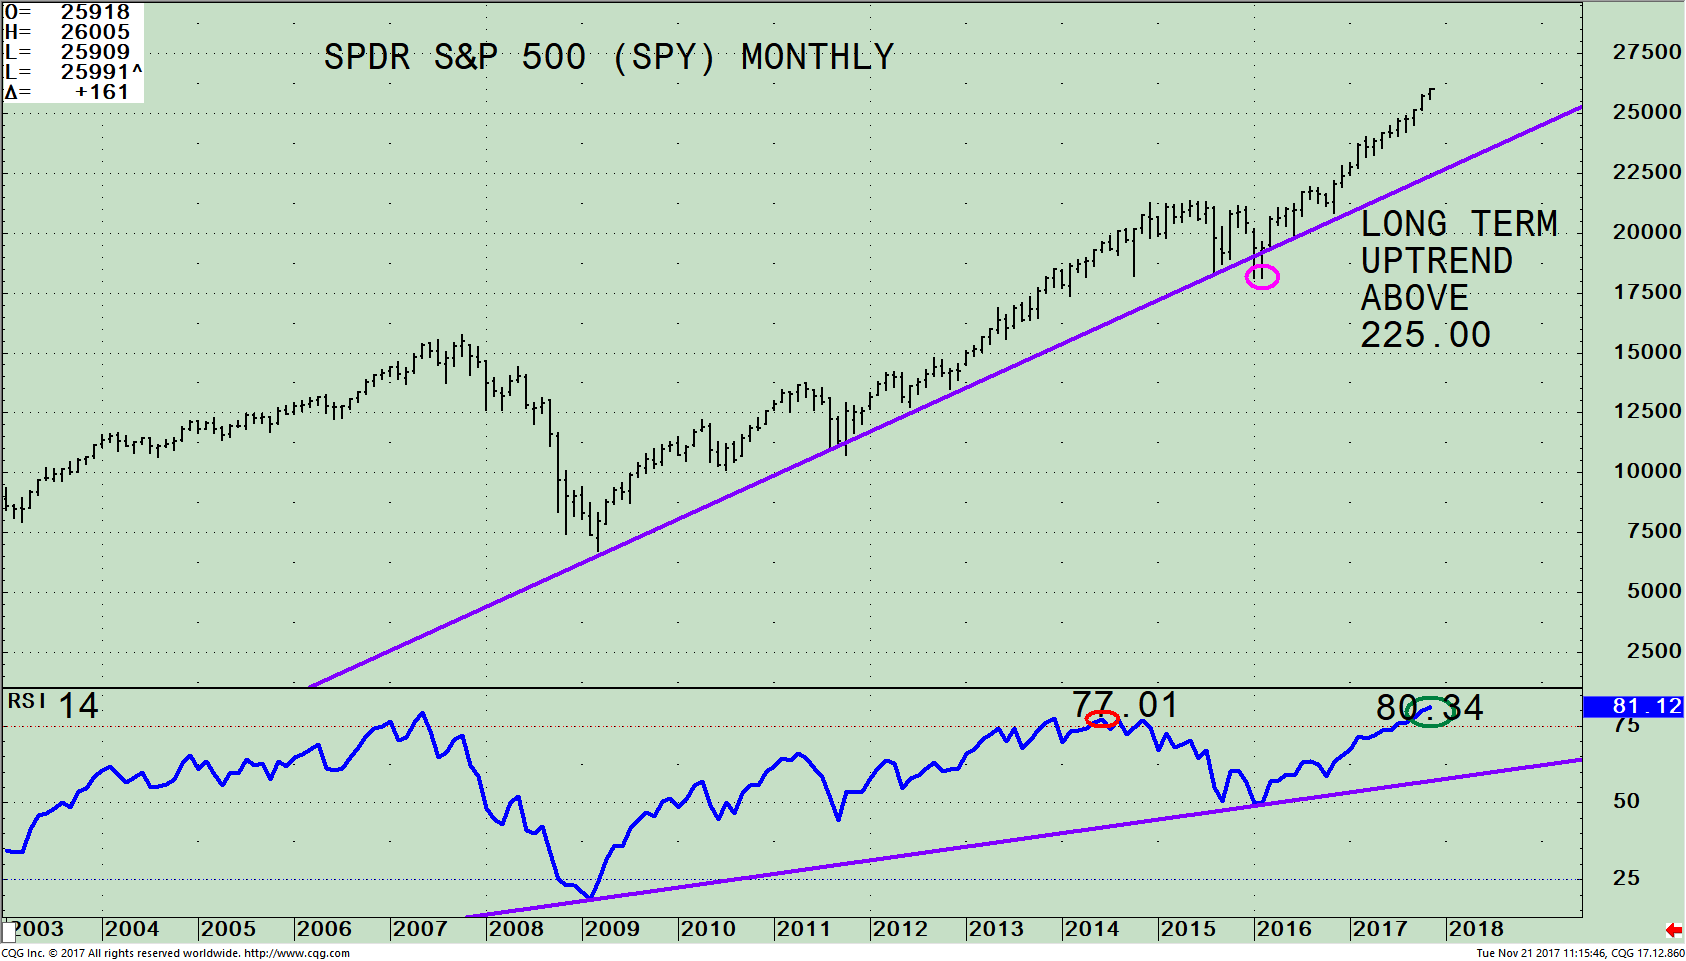
The long- term uptrend in the S&P 500 (SPY) that began in 2009 (purple line), remains intact. There was only one false overshoot for two months below the line in 2016 (pink circle). If the SPY falls below 225.00 this would turn the long-term trend negative. For now, the bulls remain in control until proven otherwise.
The bottom half of the chart shows the Relative Strength Index. The monthly RSI is also confirming the underlying momentum in the S&P 500 (SPY). It’s bullish the uptrend in RSI from 2009 is clearly intact. It’s also bullish that RSI is at 80.34 (green circle), still rising and showing strength with a higher reading than the previous peak of 77.01 the S&P had in June 2014 (red circle). It’s highly unlikely a significant decline will occur now with the long and intermediate term trend favorable.
The first decline in the S&P 500 (SPY) of more than 3-5 % will likely be a buying opportunity with at least one more rally attempt before a market top would be reached.
Summing Up:
This is a broad rally that has started after a period of consolidation. Small caps have come to life, now stronger than the S&P 500 (SPY). Market internals that were weakening and losing strength are now improving. Support levels remain intact. The intermediate and long-term trends on the S&P 500 (SPY) are up. As long as the S&P 500 (SPY) remains above 245.00, the SPY is likely to work its way higher towards 276.00.
I would love to hear from you. Please call me at 516-829-6444 or email at bgortler@signalert.com to share your thoughts or ask me any questions you might have.
Sign up for a FREE 3 issue trial of Click Here: The Systems & Forecasts Newsletter
*******Article published by Bonnie Gortler in Systems and Forecasts November 22, 2017
Disclaimer: Although the information is made with a sincere effort for accuracy, it is not guaranteed that the information provided is a statement of fact. Nor can we guarantee the results of following any of the recommendations made herein. Readers are encouraged to meet with their own advisors to consider the suitability of investments for their own particular situations and for determination of their own risk levels. Past performance does not guarantee any future results.


Create more wealth in your life
with these simple strategies.
As an added bonus you will also
receive BG’s Updates and Ezine

Discover how to quickly create more well-being in your life with these simple strategies.
As an added bonus you will also
receive BG’s Updates and Ezine

As an added bonus you will receive BG’s Updates and Ezine

All work listed on BonnieGortler.com is licensed under a Creative Commons Attribution - Noncommercial - No Derivative Works 3.0 Unported License.


Free Report:
Grow and Sustain Your Wealth
Discover how to grow your money with these easy, simple steps.

