

Bonnie’s Market Update 4/12/24
04/14/2024
“Wealth is the ability to fully experience life” – Thoreau
The market technical picture was weakening in June and the major averages ended June with losses, the first losing month of the year. The decline was limited, however. A broad rally followed when Bernanke’s comments that there was no need to worry about changes in monetary policy for now inspired traders to stop selling, The interest
rates rise in May and June have brought us back to levels from June 2012 in the 10-year Treasury Yield which spooked the bond market. For now the Bond market appears to have stabilized. Hi Yields have rallied from their lows, muni bonds have stopped falling, and the overall tone in the bond market is better.
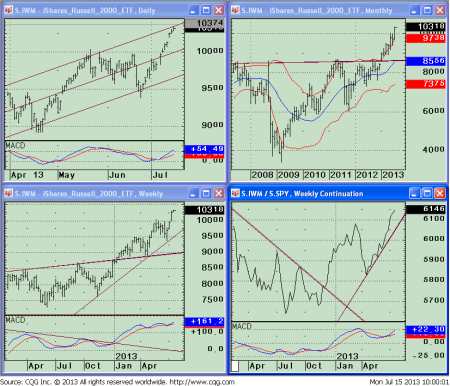
Let’s look at the US market by using charts of small caps, specifically the iShares Russell 2000 Index ETF (IWM) to see what is happening now. (See charts below.)
The daily chart, short term (top left) is trading near its top of its channel. Support is 100, resistance is at 105. A pause might be necessary to test the 102 area, but as long as we stay above 100, further gains can be expected. At the time of this writing (July 17) we have paused with a small loss for the day. Higher prices would be confirmed if the upper channel is penetrated. The weekly chart, intermediate term, (lower left) has clearly broken out to the upside with an uptrend in effect from October’s low. First support is at 95 followed by 90. Relative strength clearly favors small caps. As you can see (lower right) the ratio IWM/SPY is rising, meaning IWM is stronger than the S&P 500. The long term trend, the monthly chart (top right), has remained positive all year. A clear break out to the upside with 110 as an objective is a real possibility. Momentum patterns are favorable, and MACD is confirming the advance, making a higher high compared to 2011 along with a slight penetration of the trend line from the peak of 2007.
The Emerging Markets Outlook:
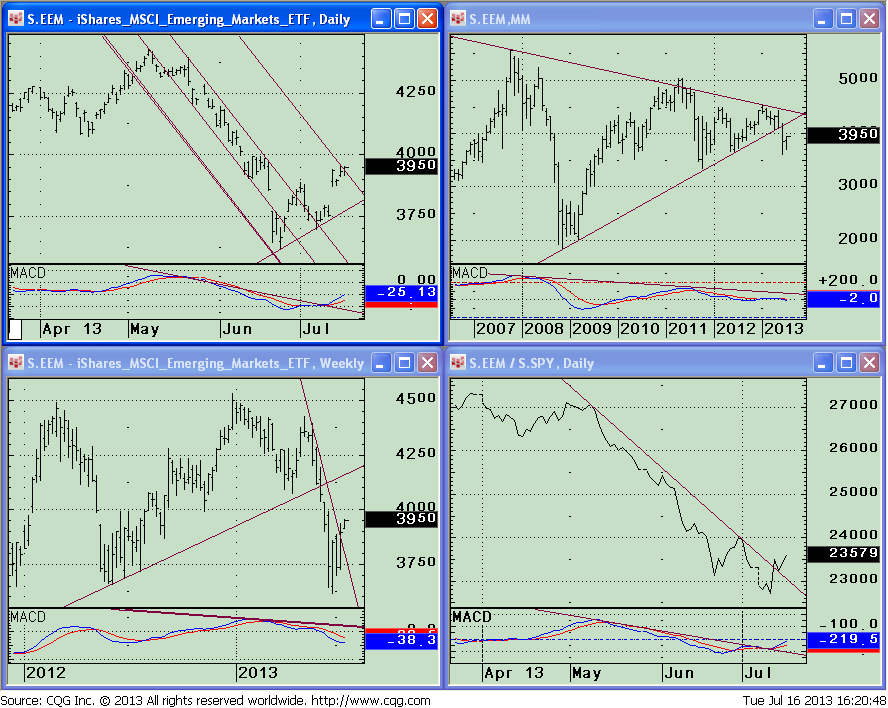
What are the charts of the iShares MSCI Emerging Markets Index ETF (EEM) saying about where we stand now?
The top 4 countries in the Emerging Market iShares MSCI Emerging Markets Index ETF (EEM) and percentage holdings as of July 16 are China 17.49%, South Korea 14.49%, Taiwan 11.89%, and Brazil 10.86%. In my last article, I discussed that the international market has been weaker than the US market this year. However, on June 16 EEM had a low of 36.16, rallied, retraced to the breakout of the trend line and held, followed by another rally. We came really close to the short term objective of 40.00 on July 17 (top left daily chart) that I was looking for. As long as we stay above 37.50 I expect the move to continue higher. The weekly chart, reflective of the intermediate-term trend (lower left) has now broken the short term down trend line, which is bullish giving higher objectives to 41.80 where the next resistance lies. In the monthly EEM chart, (top right) the long term trend remains down. However with further strength this can change and is worth keeping an eye on. There is much potential is the overseas area that can fuel the overall market higher as well as other world markets. Notice the MACD pattern. It is oversold and is still trending down, but if it can turn up we are in position to break a trend from the peak of 2007. That could be of great bullish significance and bears watching.
There is also a change in the relative strength ratio of the EEM/SPY relationship on the daily chart (bottom right). The relative strength of EEM has turned up and broke its downtrend line, now positive. It would be good if the weekly relative strength ratio can turn favorable but so far this has not occurred, but could in the future (chart not shown). There is value in this area of the market. Although it is a little early yet, but if the momentum traders get interested prices will continue higher.
Just to sum up.
The market continues to defy the odds and move higher. So far the corrections have been contained. Our models are favorable, on buy signals, with the Fed still being accommodative. The summer is here, not usually the best time for the market, a good time for a consolidation of the recent gains. Continue to review your portfolio and evaluate your risk vs. the reward potential. The Emerging Market area has come to life, the Nasdaq, including Apple (AAPL), is acting better, and small caps are leading. This is bullish tape action. I continue to give the market the benefit of doubt and expect higher prices ahead. As long as the Fed behaves, new lows on the New York Stock exchange remain low, and the shift to the international area continues, higher prices will be ahead.
Sign up now to receive FREE REPORTS about investing
including “Market Outlook 2013” at Signalert.com
This material is not intended to be, nor should it be used as, financial, legal, tax or investment advice nor an opinion or recommendation by Signalert Asset Management (“Signalert”) regarding the appropriateness of any investment. This material does not take into account the particular investment objectives or financial circumstances of any specific client or type of client. Signalert’s products may not be suitable for all clients. No representation or guarantee is made that a client is likely to achieve his or her investment objectives through investing with Signalert, or will be profitable or will not sustain a loss. Past performance is not indicative of future results.
To discover how to achieve your financial dreams click here
Visit www.BGJourneyToWealth.com for more insights to growing your wealth!

Bonnie Gortler (@optiongirl) is a successful stock market guru who is passionate about teaching others about social media, weight loss and wealth. Over her 30-year corporate career, she has been instrumental in managing multi-million dollar client portfolios within a top rated investment firm. Bonnie is a uniquely multi-talented woman who believes that honesty, loyalty and perseverance are the keys to success. You will constantly find her displaying these beliefs due to her winning spirit and ‘You Can Do It’ attitude. Bonnie is a huge sports fan that has successfully lost over 70 pounds by applying the many lessons learned through her ongoing commitment toward personal growth and development while continually encouraging others to reach their goals & dreams. It is within her latest book project, “Journey to Wealth”, where Bonnie has made it her mission to help everyone learn the steps needed to gain sustainable wealth and personal prosperity. Order your copy of ”Journey to Wealth” today!
- Subscribe to BonnieGortler.com
- Connect with Bonnie via LinkedIn, Twitter & Facebook
- Put a smile on someone’s face and Send a card on Bonnie!
- Choose your very own FREE down-loadable gift by visiting bit.ly/bgoffers
Like this post? Feel free to use it in your blog or ezine as long as you use the above signature in its entirety


Create more wealth in your life
with these simple strategies.
As an added bonus you will also
receive BG’s Updates and Ezine

Discover how to quickly create more well-being in your life with these simple strategies.
As an added bonus you will also
receive BG’s Updates and Ezine

As an added bonus you will receive BG’s Updates and Ezine

All work listed on BonnieGortler.com is licensed under a Creative Commons Attribution - Noncommercial - No Derivative Works 3.0 Unported License.
