

10 Simple Tips for Financial Well-Being
07/01/2026
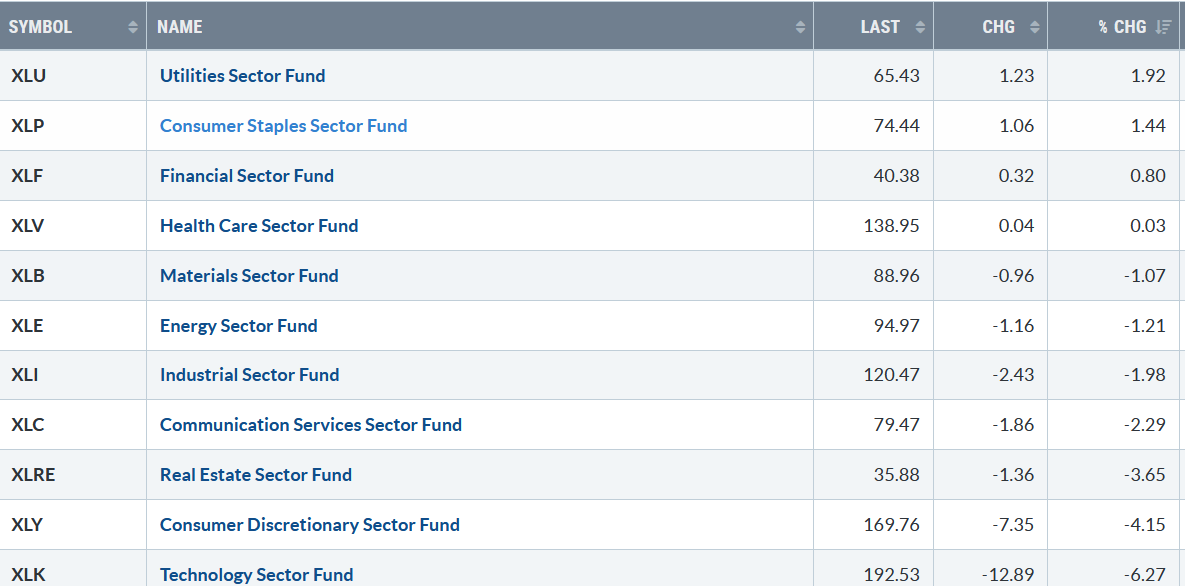
Volatility continued to rise last week. Only four of eleven S&P SPDR sectors finished higher. Utilities (XLU) and Consumer Staples (XLP), defensive sectors, were the strongest. Consumer Discretionary (XLY) and Technology (XLK) fell hard, the worst sectors. The SPDR S&P 500 ETF Trust (SPY) was down -3.07%.
S&P SPDR Sector ETFs Performance Summary 4/12/24-4/19/24
041924 SPDR Sectors
Source: Stockcharts.com
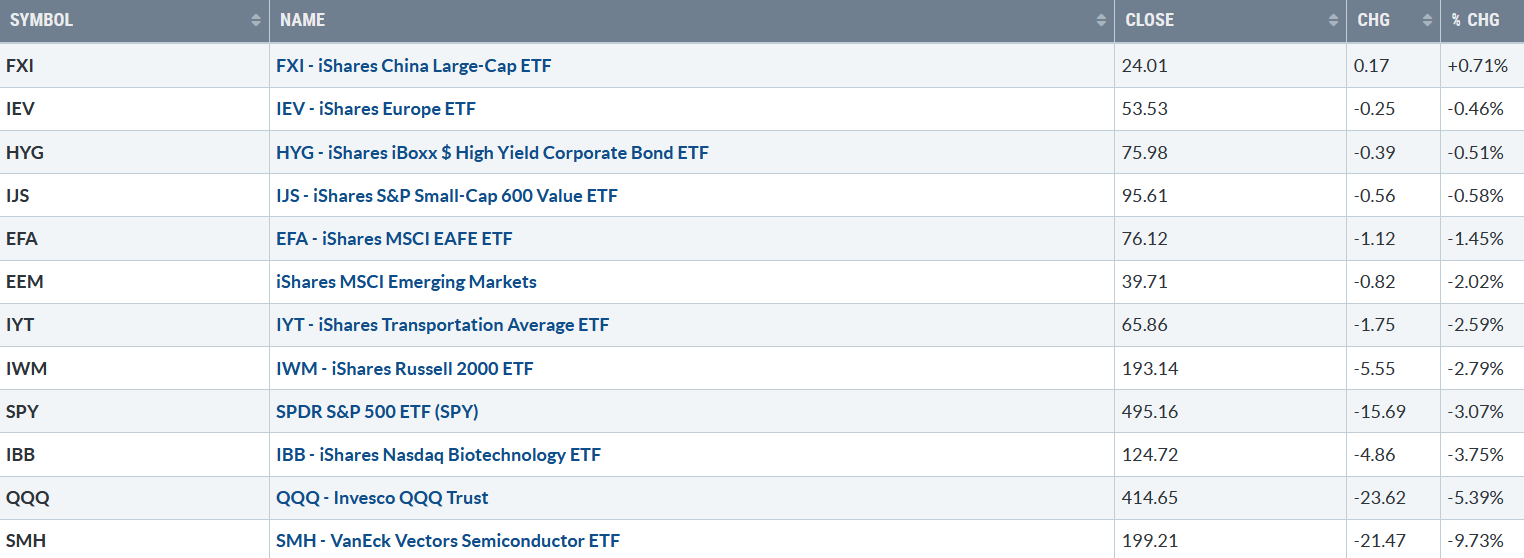
Figure 2: Bonnie’s ETFs Watch List Performance Summary 4/12/24-4/19/24
041924 Bonnie’s ETFs
Source: Stockcharts.com
Technology and Semiconductors fell precipitously last week. International markets were mostly lower but fell less than the S&P 500.
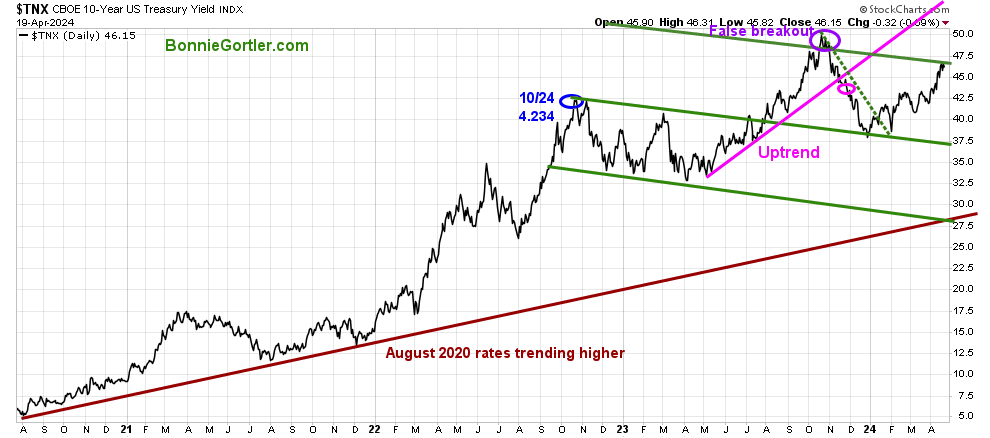
Figure 3: UST 10YR Bond Yields Daily
41924UST 10 Yr Bond Yields
Source: Stockcharts.com
The 10-year U.S. Treasury rose again last week, closing at 4.615%, at the top of the channel, but remains below the 2023 high. Yields closing above 4.75% could fuel further selling pressure in U.S. Equities.
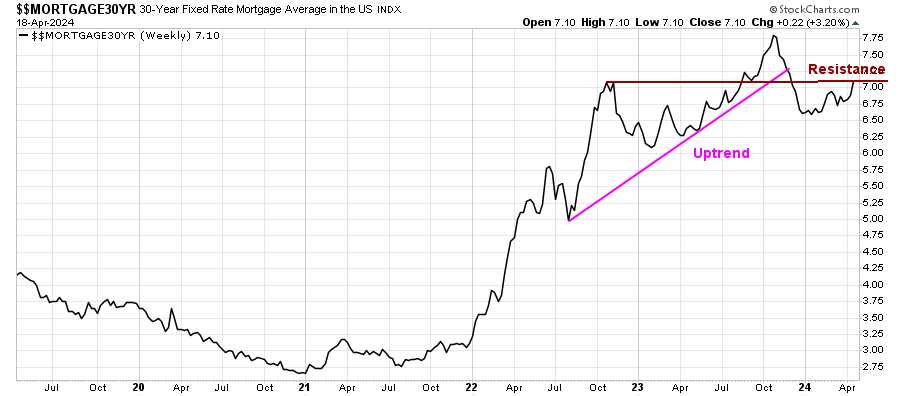
Figure 4: Weekly 30-Year Fixed Rate Mortgage Average in the US
041924 UST 30 Yr Fixed Rate Morgage Average in the US Daily
Source: Stockcharts.com
The 30-year fixed mortgage rates are no longer falling, rising since January 2024, closing at 7.10%. A weekly close above 7.30% resistance would imply mortgage rates rising towards the October 2023 high of 7.80%.
Are you interested in learning more about the stock market? Learn how to implement a powerful wealth-building mindset and simple, reliable strategies to help you grow your wealth in my eCourse Wealth Through Investing Made Simple. Learn more here.
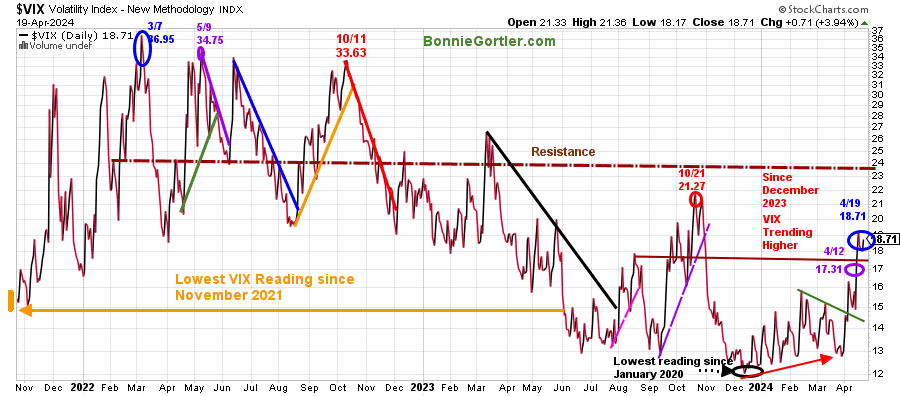
Figure 5: CBOE Volatility Index VIX
041924 VIX Daily
Source: Stockcharts.com
The CBOE Volatility Index (VIX), a measure of fear, traded above 20.00 for most of 2022, with a high at 36.95 on 3/7 (blue circle on the left), which did not get violated in 2023.
VIX has been trending higher since December 2023. Last week, VIX rose sharply for the second week, 17.31% to 18.71, up 8.09%. Since March 27, VIX is up 46.4%. Until the VIX closes below 14.30%, daily volatility is likely to remain and could increase if the VIX closes above the October 2023 high of 21.27.
The major market averages were mixed last week. The Dow was the best, up +0.01%, while the S&P 500 fell for the third consecutive week, down -3.05%, falling six straight days, and its worst losing streak since October 2022. The Nasdaq had heavy selling, down -5.52%. The Russell 2000 Index continued lower, down -2.77%.
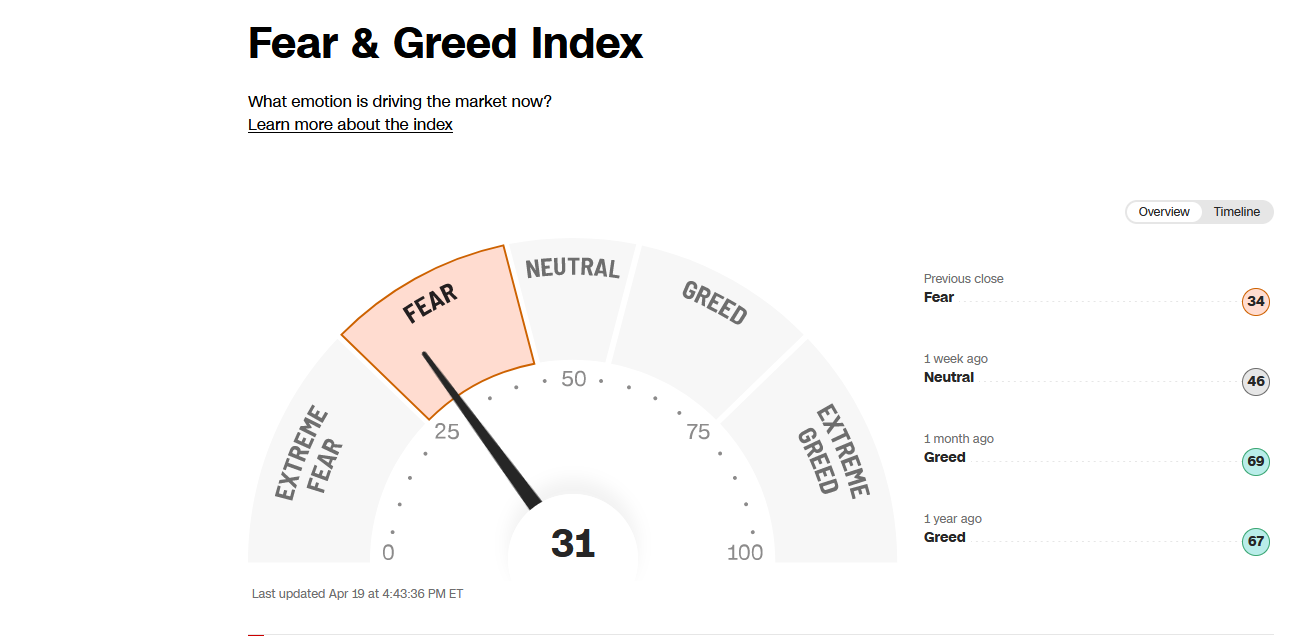
Figure 6: Fear & Greed Index
041924 Fear and Greed Index
Source: CNN.com
Investor sentiment based on the Fear and Greed Index (a contrarian index) measures the market’s mood. The Fear and Greed Index fell sharply last week from a neutral reading of 46 as investors rushed for the exit, closing at 31 in the fear zone. In the past strong market periods, after readings of Extreme Greed, there has been a retracement towards neutral or fear, which turned out to be a buying opportunity. Time will tell if this will be the case again.
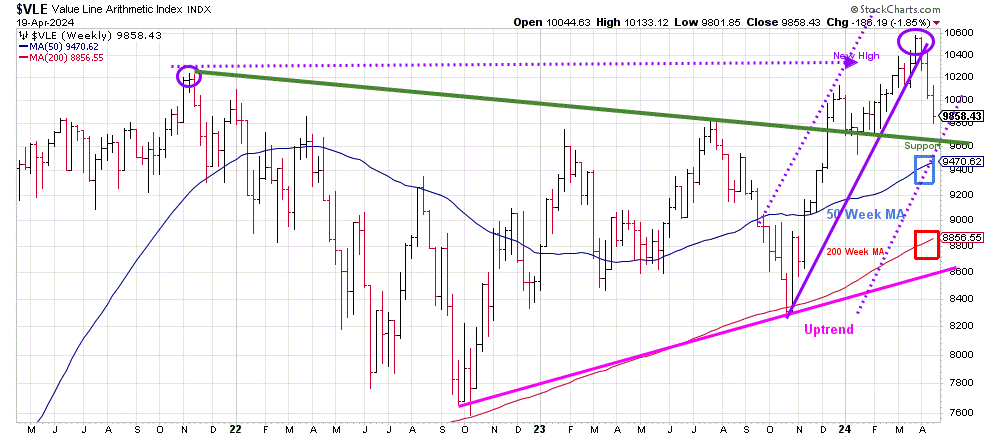
Figure 7: Weekly Value Line Arithmetic Average
041924 VLE Weekly
Source: Stockcharts.com
The top chart is the weekly Chart of the Value Line Arithmetic Index ($VLE), which includes approximately 1700 stocks.
The uptrend (pink line) since October 2023 is no longer in effect (purple line). However, the longer-term uptrend from October 2022 (pink line) remains.
VLE fell -1.85%, breaking below its support at 10000 closing near its low for the week. VLE remains above the rising 50-week MA (blue rectangle) and 200-week MA.
Support is at 9600, 9400, and 8800. Resistance is at 10133 and 10400.
It would be a positive sign that a short-term relief rally will start if VLE closes above last week’s high of 10133.12.
Weekly market breadth was negative on the New York Stock Exchange Index (NYSE) and for the Nasdaq. The NYSE had 904 advances and 2001 declines, with 45 new highs and 173 new lows. There were 1305 advances and 3300 declines on the Nasdaq, with 106 new highs and 627 new lows.
Do you want to go deeper into charting? Learn more in the comfort of your home today with my Free 33-minute Training, Charting Strategies to Cut Risk and Trade with the Trend. Sign up here.
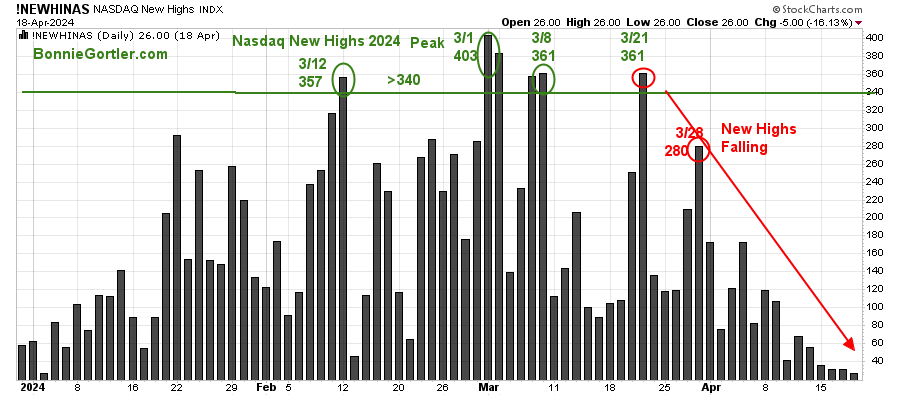
Figure 8: Nasdaq New Highs
041924 Nasdaq New Highs
Source: Stockcharts.com
The chart above is a daily chart of the number of stocks making new 52-week highs on the Nasdaq. New highs peaked on 3/1 at 403. On March 8 and 21, New Highs were less at 361, unable to surpass the high made on 3/1. Nasdaq weakened, and New Highs fell, closing at 26 on 4/19.
Figure 9: Nasdaq Advance Decline Line Daily (Top) and Nasdaq (Bottom)
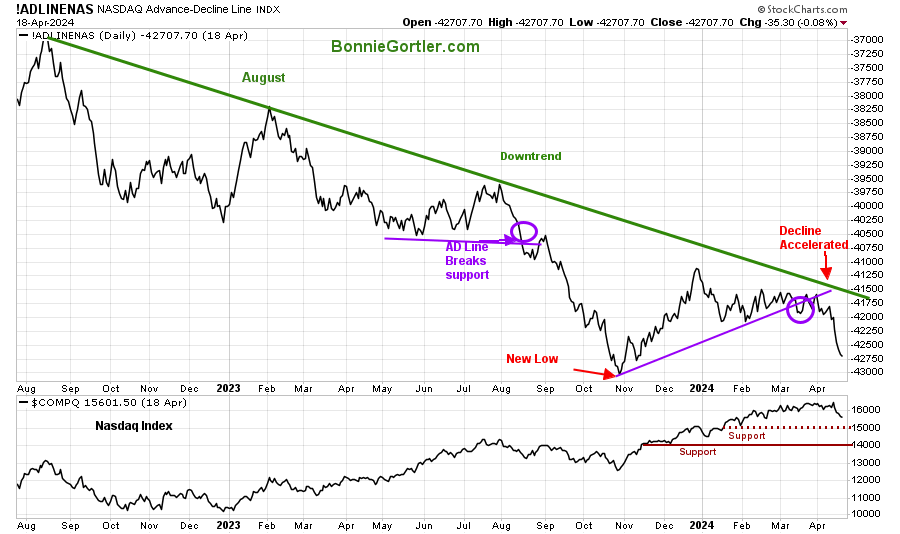
041924 Daily Nasdaq Advance Decline Line
Source: Stockcharts.com
The top chart is the Nasdaq Daily Advance-Decline Line, a technical indicator that plots the difference between the number of advancing and declining stocks.
The top chart shows the uptrend from October 2023 broke in March (purple line), warning that the risk of a pending decline in Nasdaq was increasing. In April, breadth weakened, and the decline accelerated.
Figure 10: Daily NYSE Common Stock Only Advance-Decline Line
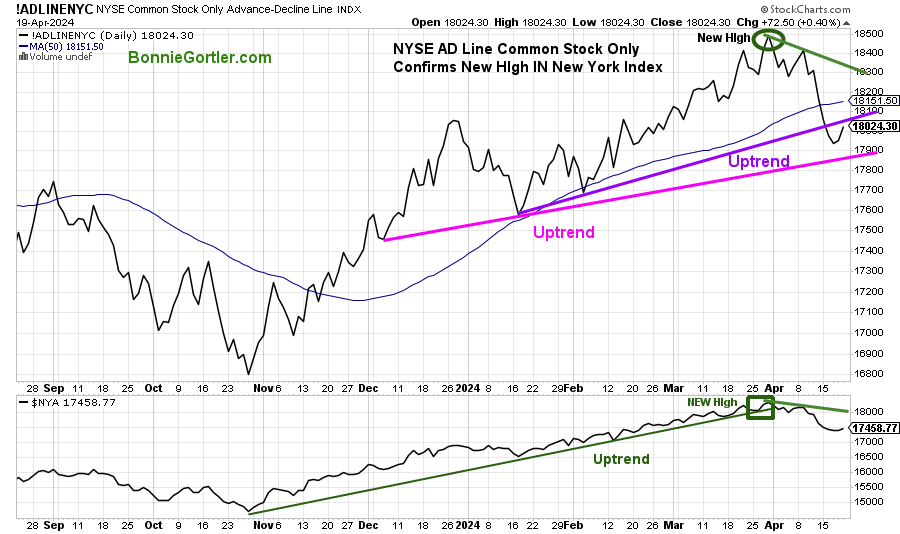
041924 Daily NYSE Common Stock Only Advance-Decline Line
The above chart is the Daily NYSE AD line (top chart), which includes only common stocks. The January uptrend broke (purple line) last week, but the uptrend from December remains in effect. The AD Line confirmed the high on the New York Stock Exchange Index (bottom chart) in March, implying the high in the New York Index has likely not occurred. Time will tell.
Figure 11: New York Stock Exchange (NYSE) New Lows
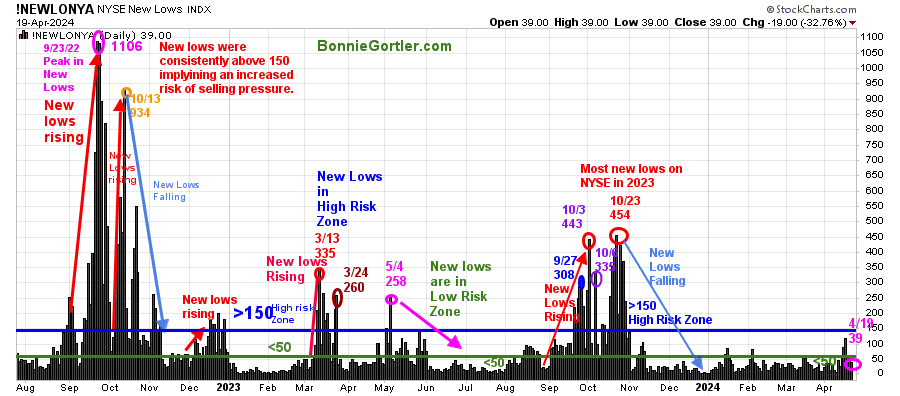
041924 NYSE New Lows Daily
Source: Stockcharts.com
Watching New Lows on the New York Stock Exchange is a simple technical tool that helps increase awareness of the direction of an immediate trend.
For most of 2022, new lows warned of a potential sharp pullback, high volatility, and “panic selling,” closing above 150. The peak reading of New Lows in 2022 was on 9/23 at 1106, not exceeded in 2023.
In 2024, New Lows stayed below 150, a sign of a healthy market. Last week, New Lows on the NYSE closed at 39 (pink circle). It would be positive in the short term if New Lows remain below 50 and then fall below 25 over the next several weeks. On the other hand, an increase above 150 would be a warning sign that the recent weakness could accelerate and lead to a deeper market correction.
Learn more about the significance of New Lows in my book, Journey to Wealth, published on Amazon. If you would like a preview, get a free chapter here.
Figure 12: Daily iShares Russell 2000 (IWM) Price (Top) and 12-26-9 MACD (Middle and Money Flow (Bottom)
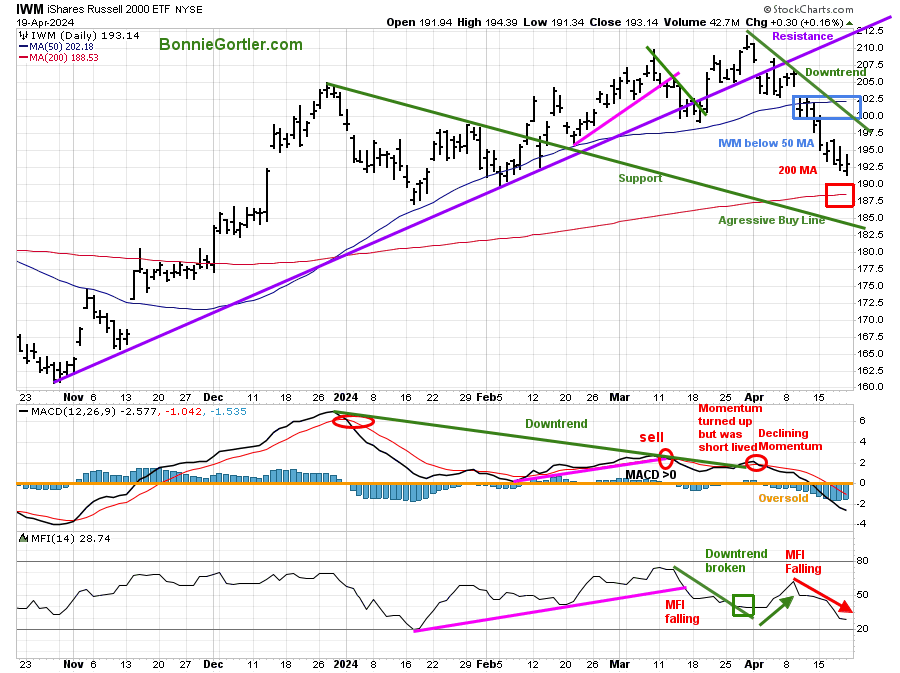
041924 IWM Daily
Source: Stockcharts.com
The top Chart is the daily iShares Russell 2000 Index ETF (IWM), the benchmark for small-cap stocks, with a 50-Day Moving Average (MA) (blue rectangle) and 200-Day Moving Average (MA) (red rectangle) that traders watch and use to define trends.
IWM peaked in March and formed a bearish pattern of lower highs. IWM remains below the 50-day MA, which implies underlying weakness. However, IWM closed above the 200-day MA, a key area I would like to hold.
Support is at 187.50 and 184.00. Resistance is 197.50, 202.50, and 212.00.
MACD (middle chart) remains on a sell, falling below 0, the most oversold since November 2023. Momentum had turned up at the end of March, breaking the 2024 downtrend, but it was short-lived and turned down.
Money flow (lower chart) broke the January uptrend (green line) in early April but has been falling. It would be a positive sign that investors are more interested in Small Caps if the money flow increases and goes above 50.
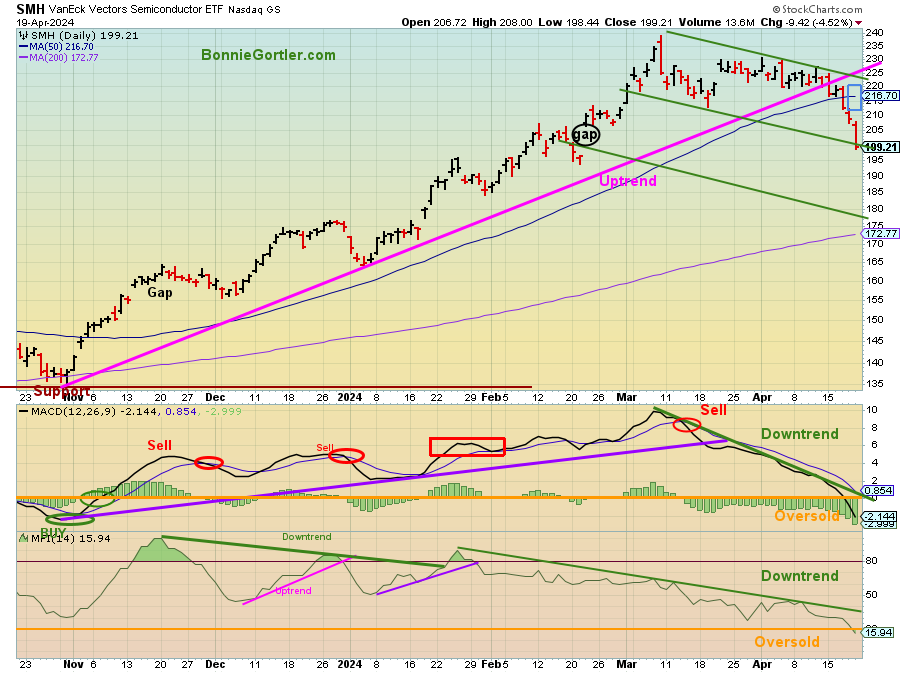
Figure 13: Daily Semiconductors (SMH) (Top) and 12-26-9 MACD (Middle) and Money Flow (Bottom)
041924 SMH Daily
Source: Stockcharts.com
The top chart shows the Daily Semiconductors (SMH) ETF, concentrated mainly in US-based Mega-Cap Semiconductor companies. SMH tends to be a lead indicator for the market when investors are willing to take on increased risk, and the opposite is true when the market is falling.
SMH broke the daily uptrend from November 2023 (pink line) shifting the daily trend to down.
The Semiconductor ETF (SMH) peaked on March 3/8 at 239.14, trended lower, and was consolidating its gains. However, last week, SMH broke support at 220, and selling intensified, down -9.73% for the week, filling February’s gap (black circle), closing at 199.21.
Support is at 190.00, 185.00, 177.00 and 172.00. Resistance is at 208.00, 217.00, 220.00, and 225.00.
MACD (middle chart) remains on a sell below 0, falling in a downtrend, the lowest reading since October 2023, not yet forming a bottom formation.
Money Flow (lower chart) remains in a downtrend from January and is now short-term oversold. However, there has been no turn-up yet. It would be short-term bullish if Money Flow turns up and breaks the January 2024 downtrend.
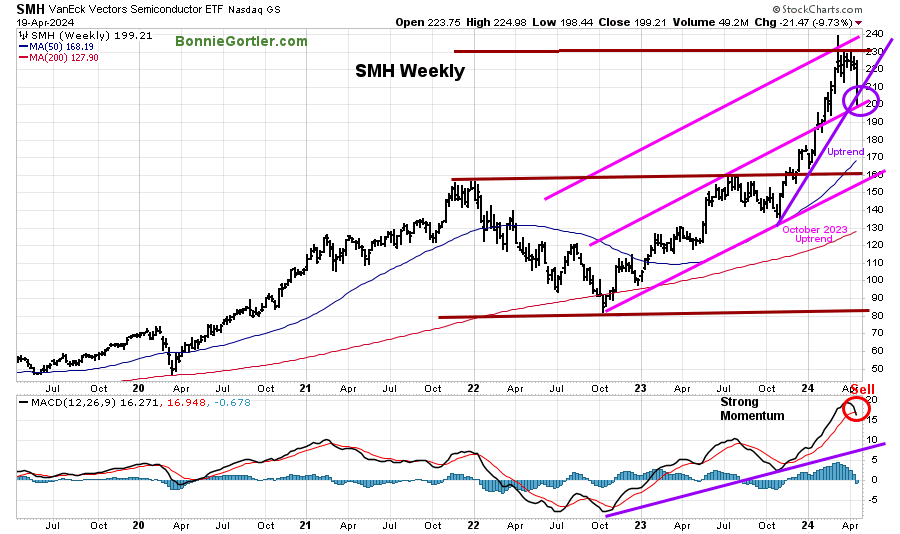
Figure 14: Weekly Semiconductors (SMH) (Top) and 12-26-9 MACD (Bottom)
041924 SMH Weekly
Source: Stockcharts.com
The Semiconductors (SMH) intermediate uptrend from October 2023 broke (purple line) on Friday, 4/19/24, closing slightly below 200.00 at 199.21.
MACD (bottom chart) generated a sell last week after strong momentum and higher highs since the rise from October 2023, implying that the final top has likely not been made.
It is too early to tell if Friday’s sell-off was only stops hit, as investors dumped their stock, or if the decline will continue to accelerate. Based on the strong intermediate momentum and the October 2023 uptrend remaining in effect, a relief rally is likely. A weekly close above 208.00 would be positive for the short term.
Do you want more knowledge about the stock market? Learn how to implement a powerful wealth-building mindset and simple, reliable strategies to help you grow your wealth. Check out my eCourse Wealth Through Investing Made Simple Here.
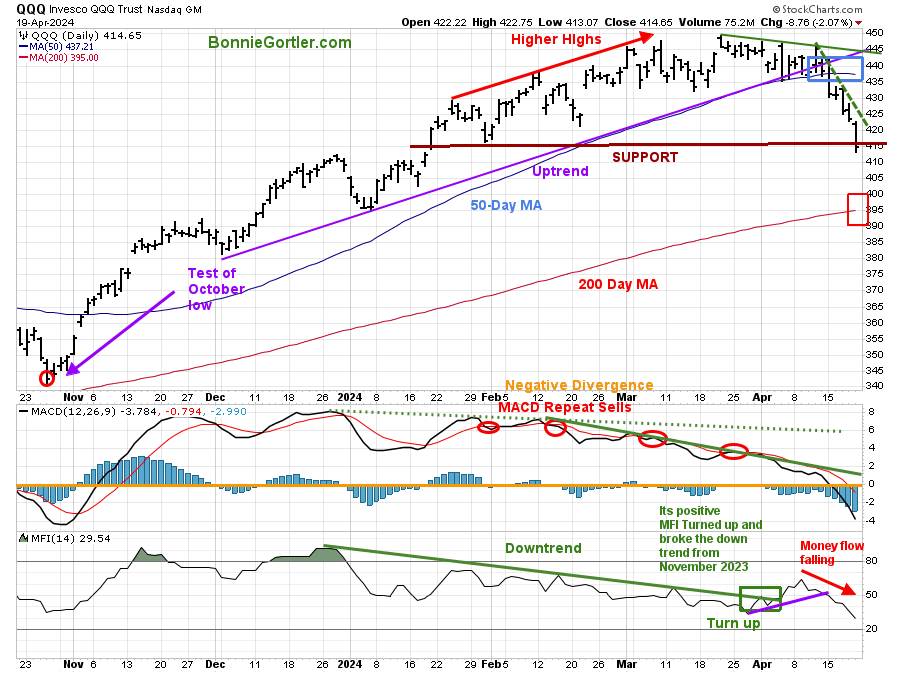
Figure 15: Daily Invesco QQQ Trust (QQQ) Price (Top) and 12-26-9 MACD (Bottom)
041924 QQQ Daily
Source: Stockcharts.com
The Chart shows the daily Invesco QQQ, an exchange-traded fund based on the Nasdaq 100 Index. QQQ made a low in October 2023 (red circle), followed by a successful retest of the low in early January 2024 and the start of an uptrend.
Nasdaq 100 (QQQ) fell sharply 5.39% last week as the largest holdings, Apple (AAPL), Microsoft (MSFT), and Amazon (AMZN), all fell over 5%, and NVIDIA (NVDA) was down -13.6%.
QQQ closed below the 50-day Moving Average (blue rectangle) early in the week, tripping stops, and the decline accelerated. QQQ remains above the 200-day Moving Average (red rectangle).
Support is at 395.00. Resistance is at 416.00, 430.00, and 445.00.
The bottom chart, MACD (12, 26, 9), remains on a sell, below 0, falling, lowest reading since November 2023. MACD in a downtrend (green line).
Money flow (lower Chart) had turned up in April but continues to fall. A turn-up in Money Flow with a MACD buy and break of the MACD momentum downtrend would be short-term positive.
In Sum:
QQQ is oversold, which is not a buy itself. Momentum has not shown signs of a turn or a positive divergence. QQQ could rise soon if the top holdings stabilize, but no safe buying pattern has developed yet.
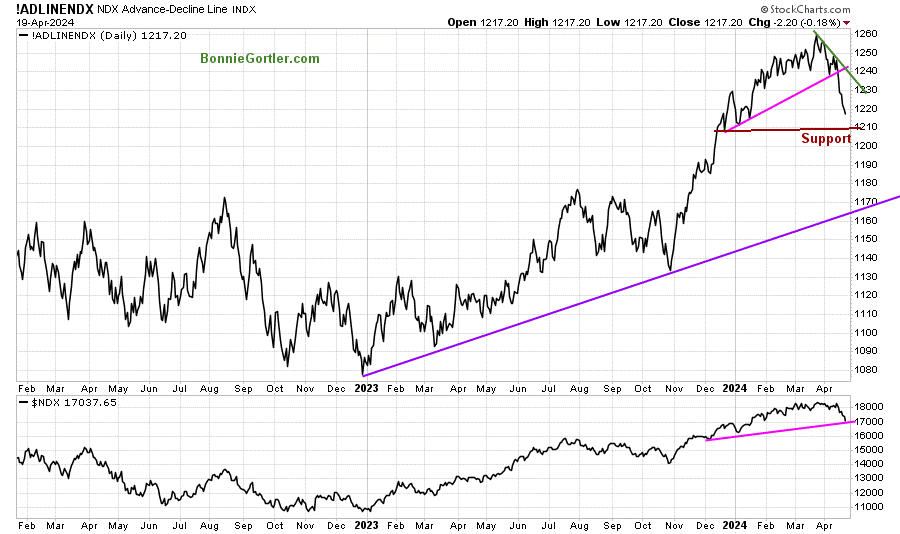
Figure 16: Nasdaq 100 (NDX) Advance Decline Line (Top Chart) and NDX Index (Bottom Chart)
Daily NDX AD Line and NDX
Source: Stockcharts.com
The December 2023 NDX Advance Decline Line broke last week. However, the 2023 uptrend remains in effect.
The lower chart is the Nasdaq 100 (NDX), closing at 17037.65, remaining in an uptrend since December 2023. Further weakness will break the uptrend.
Figure 17: Nasdaq Composite (Top), 12-26-9 MACD (Middle) and Money Flow (Bottom)
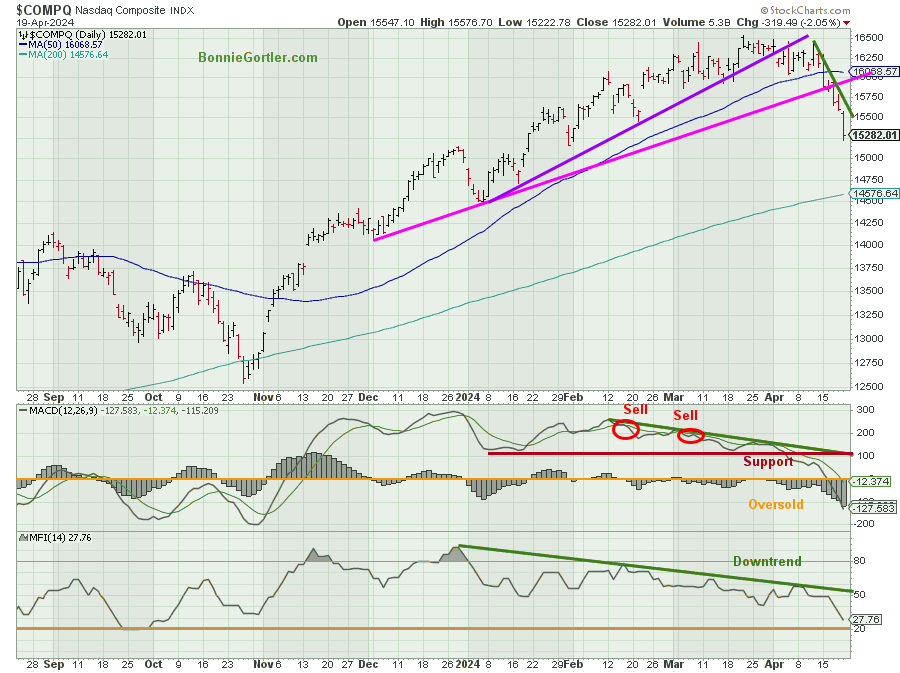
041924 Daily Nasdaq Comp with MACD and MFI
Source: Stockcharts.com
The Nasdaq Composite (top chart) had its worst week since October 2022, breaking the uptrends from December 2023 and January 202. Downside momentum continues based on MACD (middle chart) and Money Flow. Both indicators are in a downtrend and falling (bottom chart). No safe buying pattern has developed yet.
Figure 18: The S&P 500 Index (SPY) Daily (Top) and 12-26-9 MACD (Middle) and Money Flow (Bottom)
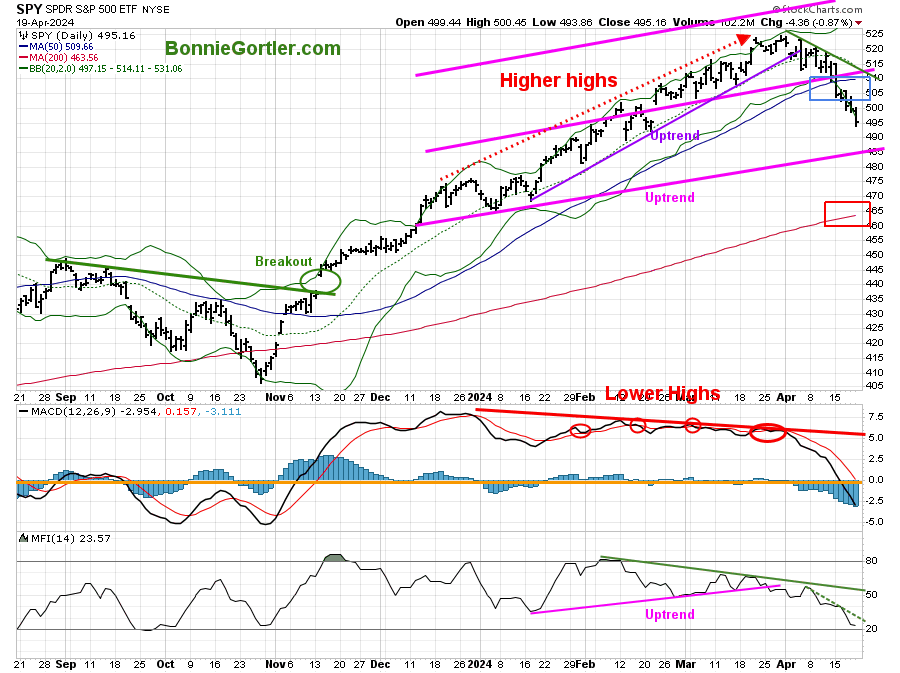
041924 SPY Daily
Source: Stockcharts.com
The SPY has pulled back 5.5% from its peak, breaking the 2024 daily uptrend (purple line) in early April, shifting the daily trend from up to down.
The SPY closed at 495.16, down -3.07% for the week, accelerating lower after breaking support and the 50-day Moving Average (blue rectangle). SPY closed above the 200-day Moving Average (red rectangle).
Support is at 485.00 and 465.00. Resistance is at 502.00, 515.00, and 525.00.
MACD (middle chart) remains on a sell below 0, falling after moving sideways with lower highs.
Money Flow (bottom chart) continues to fall and remains in a downward trend.
SPY is short-term oversold, but no sign of a short-term bottom has formed. It will be favorable if SPY closes for two days above resistance at 502.00 and closes above last week’s high of 515.30.
Summing Up:
It was a glum week for Semiconductor and Technology stocks, which sold off sharply. The Nasdaq and S&P 500 had their worst week since September 2023. Technical indicators are short-term oversold, which is not a buy-in in itself. Momentum has not shown signs of a turn or a positive divergence. Indicators continue to show declining momentum, with no safe buying patterns developed, implying a short-term bottom has formed. Market volatility is on the rise. Review your portfolio now to determine how invested you are and assess your risk if there is no relief rally, and the decline accelerates.
Remember to manage your risk, and your wealth will grow.
Let’s talk about investing together. You are invited to schedule your Free 30-minute consultation here or by emailing me at Bonnie@BonnieGortler.com. I would love to schedule a call and connect with you.
Disclaimer: Although the information is made with a sincere effort for accuracy, it is not guaranteed that the information provided is a statement of fact. Nor can we guarantee the results of following any of the recommendations made herein. Readers are encouraged to meet with their own advisors to consider the suitability of investments for their own particular situations and for determination of their own risk levels. Past performance does not guarantee any future results.


Create more wealth in your life
with these simple strategies.
As an added bonus you will also
receive BG’s Updates and Ezine

Discover how to quickly create more well-being in your life with these simple strategies.
As an added bonus you will also
receive BG’s Updates and Ezine

As an added bonus you will receive BG’s Updates and Ezine

All work listed on BonnieGortler.com is licensed under a Creative Commons Attribution - Noncommercial - No Derivative Works 3.0 Unported License.


Free Report:
Grow and Sustain Your Wealth
Discover how to grow your money with these easy, simple steps.

