

Bonnie’s Market Update 4/12/24
04/14/2024
The S&P 500 (SPY) has been moving mostly sideways for three months, a few percent up or down, in a trading range. The next earning season is starting the second week in April, which will likely increase market volatility. However, our models suggest a major correction is not going to happen now. One could be possible later in the year. What could cause a significant market correction? When will buying on the dips be a losing strategy? Will the threat of an interest rate hike over the market be the catalyst for heavy selling? So far this is not the case. Is the market going to pull back and break the recent lows of 3/26/15 or rally toward the highs and break through them with another leg up? The jury is still out, but I believe that the biotechnology sector will tip us off before a significant decline gets underway.
What Are The Charts Saying?
Biotechnology (XBI) has been a powerhouse, leading the stock market higher. The easy money could be over. With momentum clearly weakening, risk is increasing. Biotechnology has now joined the Nasdaq 100 Index (QQQ, see the 03/20/15 newsletter) in showing chart patterns that give a warning of a possible decline ahead and increasing risk.
SPDR S&P Biotech ETF (XBI) Weekly Price and Trend Channels (top), and 14 week RSI (bottom)
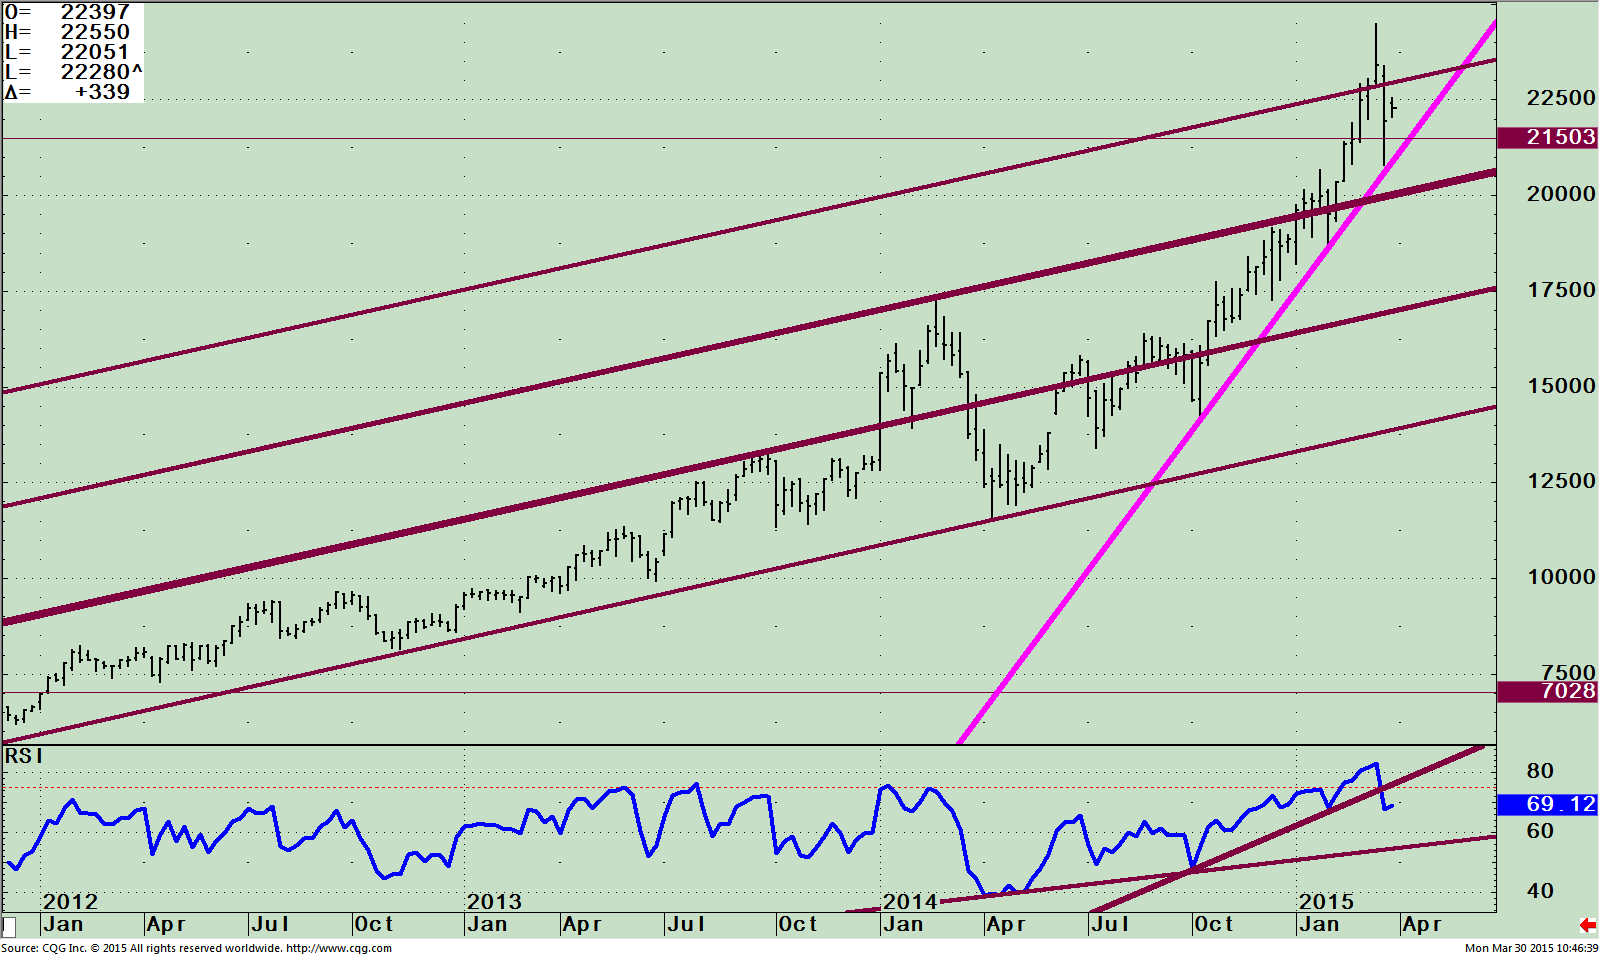 The top part of the chart to the right is the SPDR S&P Biotech ETF (XBI). The assets that comprise the top 10 holdings as of 03/27/ 15 are 12.01%. Even though this is a very volatile ETF, its holdings are well diversified, with the largest (Prothena Corp PLC, PRTA) representing only 1.40%. This index is made up of the biotechnology sub-industry portion of the S&P Total Markets Index that tracks all the U.S. common stocks listed on the NYSE, AMEX, NASDAQ® National Market and NASDAQ Small Cap exchanges.
Notice the XBI made a low in October 2014 at 141.85, followed by a very impressive rise to 244.98 peaking on 03/20/15, a rise of 72.70%. Biotechnology is highly volatile compared to the S&P 500 as you can see by the large gains and the quick reversal of 15% within a week. The XBI penetrated the weekly channel on March 20, suggesting that its rally would continue. Instead, XBI reversed sharply falling to 207.75, stopping at the up trendline from October’s low, an important area to hold. Biotechnology has since stabilized off of its lows. A break below 207.75 would break the uptrend.
The lower portion of the chart is the Relative Strength Index (RSI), a technical momentum oscillator that, like MACD, helps you identify overbought and oversold conditions and can be used by traders to buy weakness and sell strength. When RSI is 70 or above it’s considered overbought, and if the RSI hits 30, it’s oversold.
In a very strong trended market RSI can get to 80 before prices tend to stall. In a very weak market 20 is hit before the market finally bottoms. I like to use RSI to spot potential turns and trend changes after a large rise or fall or when a trendline is broken like what just occurred in the XBI index.
The uptrend from April 2014 has not been violated, but notice the uptrend in RSI from October 2104 has been broken to the downside. This leads me to expect further weakness in XBI to take out the recent low of 207.75 and possibly test the lower channel of 200.00. This is a warning that now is a time to be cautious about taking new investments and take some profits. You don’t want to be caught in biotechnology if the bullish trend changes. The uptrend from April 2014 has not been violated. Support is at 200.00, a break below would suggest prices could fall to 165.00.
Weekly XBI/SPY ratio (top) and RSI of the XBI/SPY ratio (bottom)
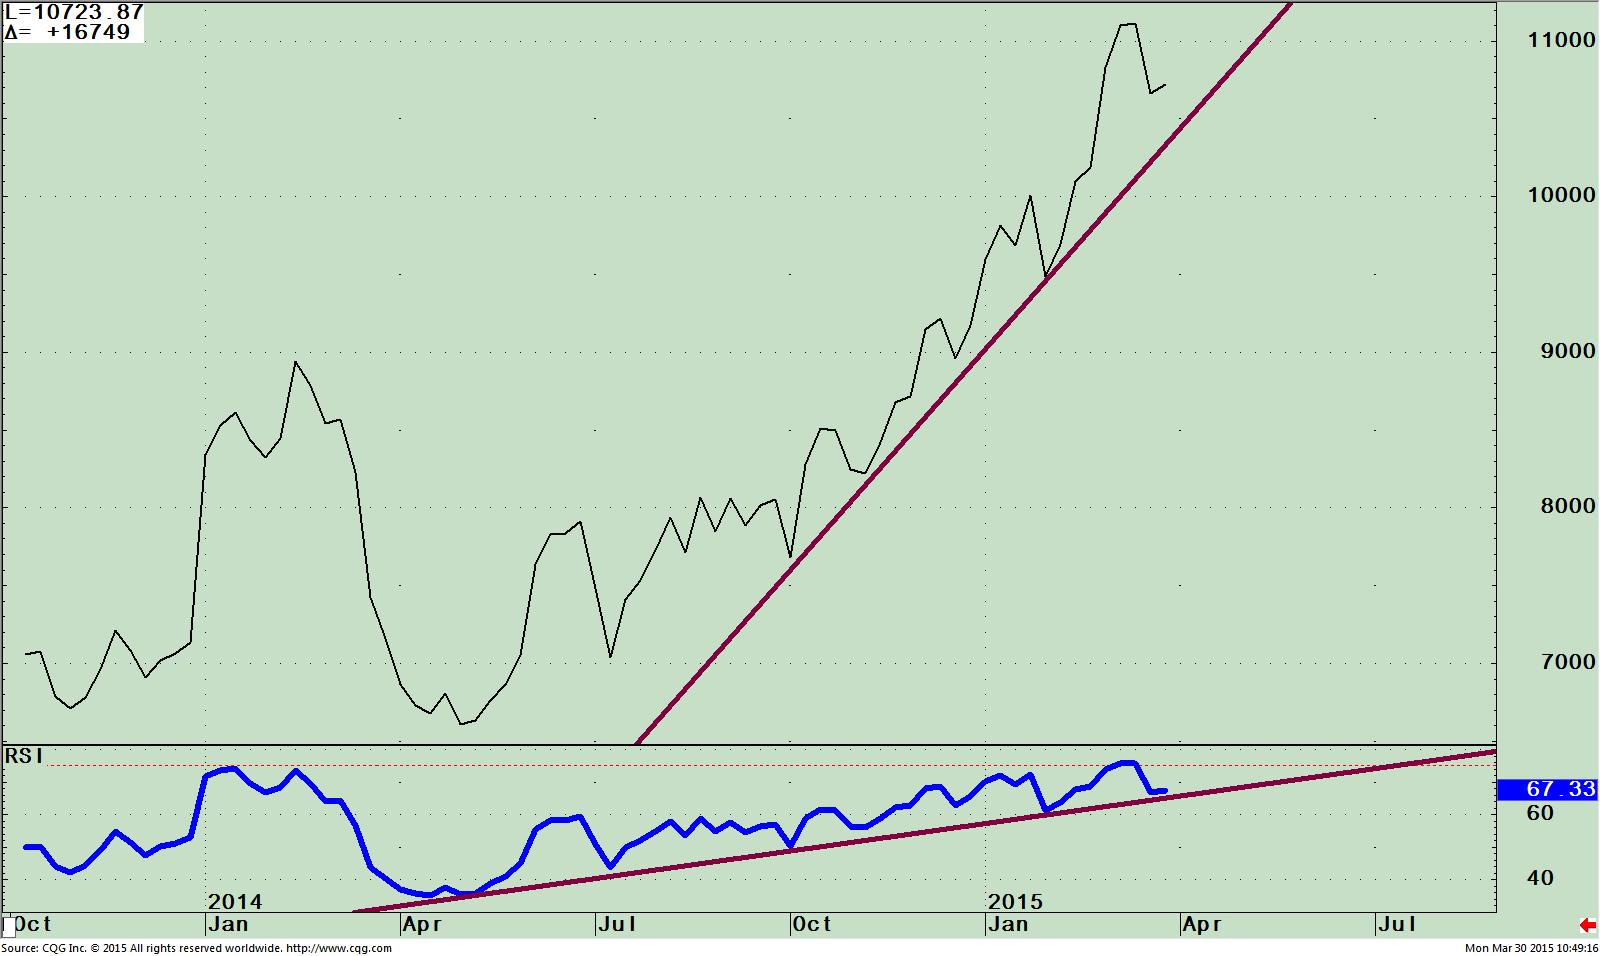 It appears that investors are moving away from the riskier areas of the stock market. The top portion of the chart shows that relative strength shifting from the Biotechnology sector (XBI) to favoring the S&P 500 (SPY). A turn down in the relative strength ratio of XBI/SPY has taken place but so far the price uptrend from October 2014 remains in effect. If the trend line is violated expect XBI to fall faster than the S&P 500. The RSI of the XBI/SPY Ratio (lower part) is worth watching. The trendline is intact but further weakness would confirm the possibility that the high in XBI/SPY has been made and that the overall leadership has changed to favor SPY over XBI for the intermediate term, suggesting slower gains not only for biotechnology, but also for technology and higher risk sectors.
Just To Sum Up.
Our models continue to be favorable for the intermediate term suggesting below average risk for a serious correction, but the chart patterns are showing investors moving out of biotechnology, joining technology which is also losing relative strength to the S&P 500. The uptrend in RSI from October 2104 has been broken to the downside so I am expecting further weakness in XBI to take out the recent low of 207.75 and possibly test the lower channel of 200.00. If you are invested in biotechnology, this would be a good time to reduce holdings, take profits and rotate into a new sector with less risk.
Would you like to be more prepared if the stock market trend changes from bullish to bearish?
Let’s talk, I invite you to contact me and share your challenges. Call me at 1-844-829-6229 or Email me at bgortler@signalert.com with your observations.


Create more wealth in your life
with these simple strategies.
As an added bonus you will also
receive BG’s Updates and Ezine

Discover how to quickly create more well-being in your life with these simple strategies.
As an added bonus you will also
receive BG’s Updates and Ezine

As an added bonus you will receive BG’s Updates and Ezine

All work listed on BonnieGortler.com is licensed under a Creative Commons Attribution - Noncommercial - No Derivative Works 3.0 Unported License.
