

10 Simple Tips for Financial Well-Being
07/01/2026
Technology continues to lead the overall market and outperforms other major averages. The Nasdaq Composite is stronger than the S&P 500 Index, a condition that has characterized more favorable overall market climates historically. In May, we saw the first noteworthy selling that generated the most fear and angst seen in many months among investors (including me). But the decline was short-lived as stocks have rebounded. Broad market indexes are resilient as price trends remain intact. Our models remain overall neutral-positive.
But we are not in the clear. Leadership has been thin. Stocks making new 52 week highs on the New York Stock Exchange index have been rather lackluster. The bellwether Financials Sector SPDR (XLF) was a hot sector early in the year. However, in recent weeks financials are lagging, not a good sign for the bulls.
The momentum of the rally has been diminishing over time and warning signals are starting to appear. As discussed below small-caps remain in their 16-month old price uptrend that began (on monthly charts) in February, 2016. However, the relative strength trend of small caps outperforming large caps that also started in February 2016 has now been broken. In general, when financials and small caps are weak, this is not a sign of a healthy market.
So the question remains: will the major averages will break out to new highs and begin another leg up, or will the major averages stall, turn lower and usher in a more meaningful decline?
11 Clues You Want To Watch For a Potential Trend Change
Warning: A potential trend change has been given by Russell 2000 (IWM).
Russell 2000 Index (IWM) ETF Weekly Top and (IWM) Russell 2000 Index / (SPY) S&P 500) Ratio (Bottom)
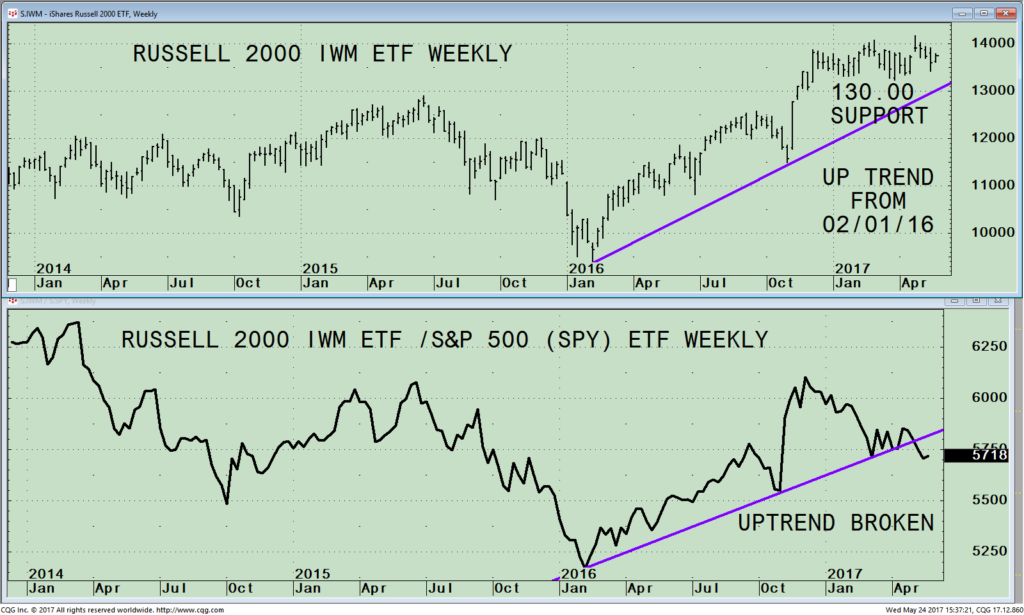
The top portion of the chart shows the weekly iShares Russell 2000 Index ETF (IWM) which is made up of companies with a market capitalization of between $300 million and $2 billion. After the election last November, small caps lead the advance.
Strong gains followed in January and February this year peaking on 04/26/17 at 141.81. The IWM has been unable to generate enough momentum to break out and regain the strength it had early in the year because investors have favored large-cap growth stocks.
The Russell 2000 (IWM) has been in an uptrend since 02/01/16. The intermediate uptrend will remain intact as long as the IWM is above 130.00. If the intermediate trend is violated, this would not be a good sign and the likelihood of a potential serious decline would increase.
The bottom part of the chart is the Weekly Russell 2000 /S&P 500 (IWM/SPY ratio). A rising line means the IWM is stronger, and if falling, the S&P 500 is stronger. The IWM ratio was steadily rising with a few small turn downs but holding above the uptrend line (purple line). However, the uptrend from 02/01/16 has been broken.
Summing Up:
A warning of a potential trend change has just been given. I recommend reviewing your portfolio to make sure you are not overly exposed to small caps. Historically, when IWM is stronger than the S&P 500 (SPY) it has been a bullish condition for the broad market. This condition is no longer supporting the market. Risk has increased. For those of you who have large holdings, I suggest shifting your assets out of small caps and move into S&P 500 (SPY) or raise cash and wait for a safer buying opportunity later this year. If the IWM fails to take out its high and turns down below support at 130.00, you can expect further weakness in IWM and could potentially spread into other sectors of the market.
I would love to hear from you. Please call me at 516-829-6444 or email at bgortler@signalert.com to share your thoughts or ask me any questions you might have.

If you like this article, then you will love this!
Free Instant Access to
Grow Your Wealth and Well-Being E-Book HERE
*******Article published by Bonnie Gortler in Systems and Forecasts May 25, 2017
Disclaimer: Although the information is made with a sincere effort for accuracy, it is not guaranteed that the information provided is a statement of fact. Nor can we guarantee the results of following any of the recommendations made herein. Readers are encouraged to meet with their own advisors to consider the suitability of investments for their own particular situations and for determination of their own risk levels. Past performance does not guarantee any future results.


Create more wealth in your life
with these simple strategies.
As an added bonus you will also
receive BG’s Updates and Ezine

Discover how to quickly create more well-being in your life with these simple strategies.
As an added bonus you will also
receive BG’s Updates and Ezine

As an added bonus you will receive BG’s Updates and Ezine

All work listed on BonnieGortler.com is licensed under a Creative Commons Attribution - Noncommercial - No Derivative Works 3.0 Unported License.


Free Report:
Grow and Sustain Your Wealth
Discover how to grow your money with these easy, simple steps.

