

10 Simple Tips for Financial Well-Being
07/01/2026
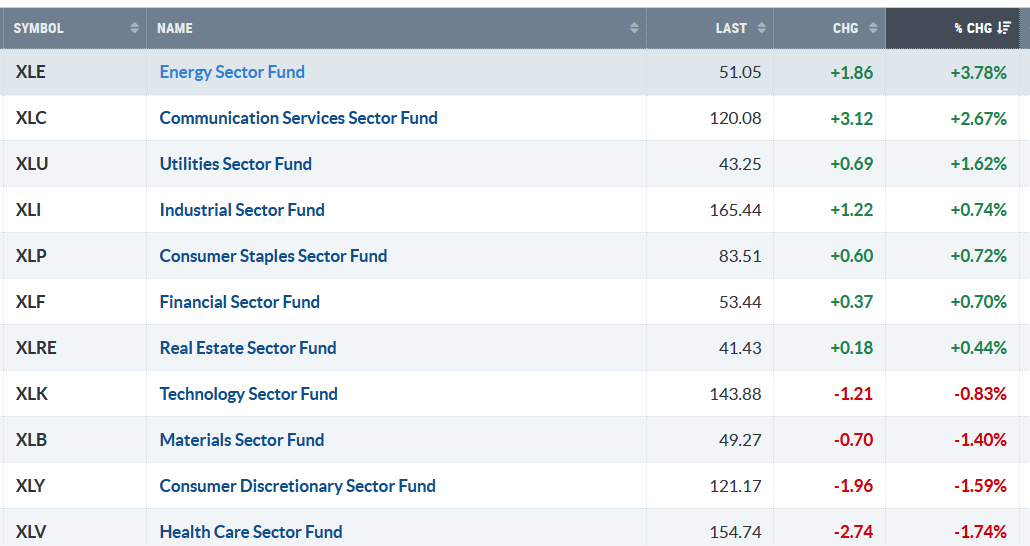
A volatile week to end the month of January. Seven of the eleven S&P SPDR sectors were higher last week. Energy (XLE) and Communication Services (XLC) were the strongest sectors, while Consumer Discretionary (XLY) and Health Care (XLV) were the weakest. The SPDR S&P 500 ETF Trust (SPY) gained +0.40%.
S&P SPDR Sector ETFs Performance Summary 1/23/26-1/30/26
013026 SPDR Sectors
Source: Stockcharts.com
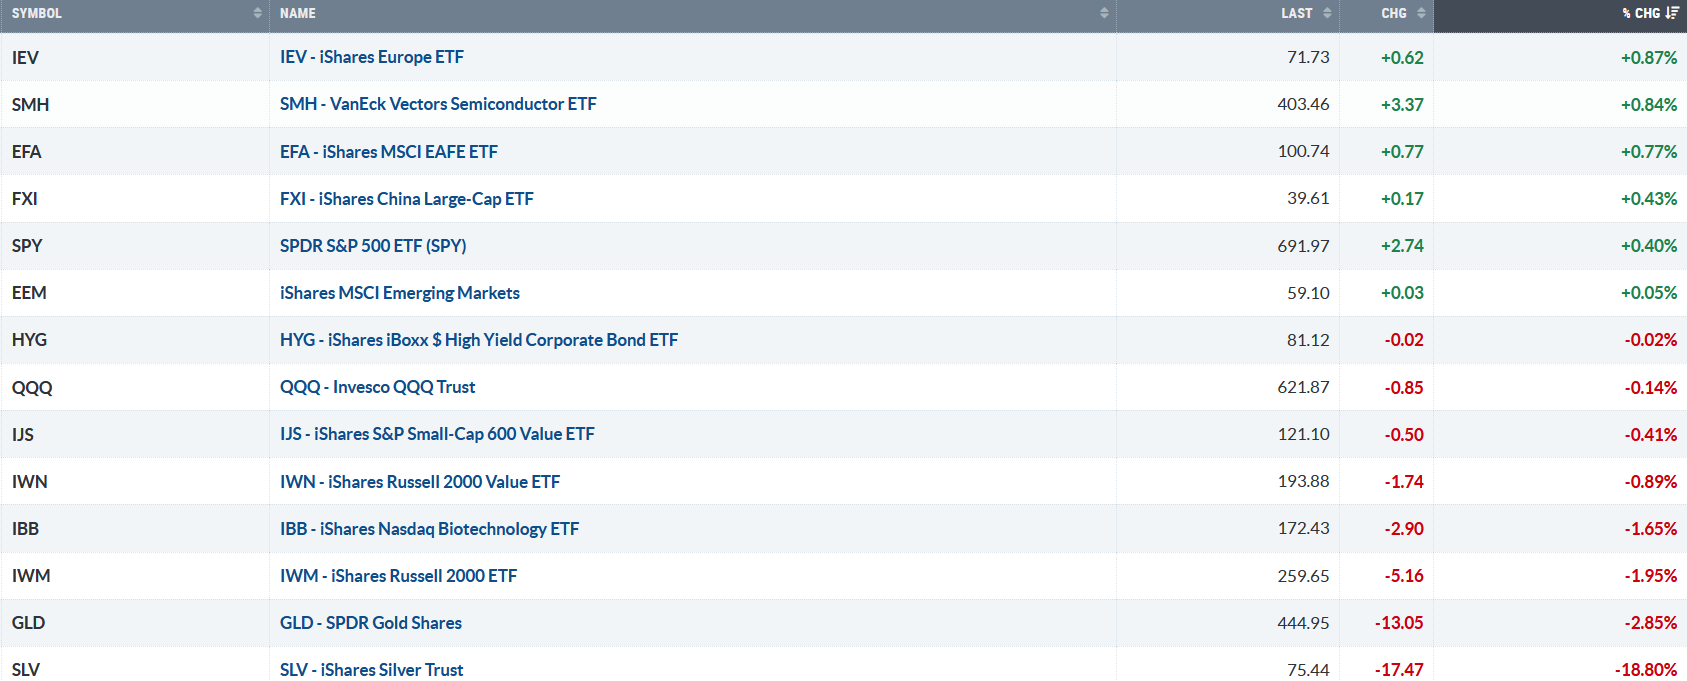
Figure 2: Bonnie’s ETFs Watch List Performance Summary 1/23/26-1/30/26
013026 Bonnie’s ETF Watch List
Source: Stockcharts.com
International markets outperformed the U.S. market. Silver led commodities lower, down almost 20% for the week. Small Cap Growth and Value were weak.
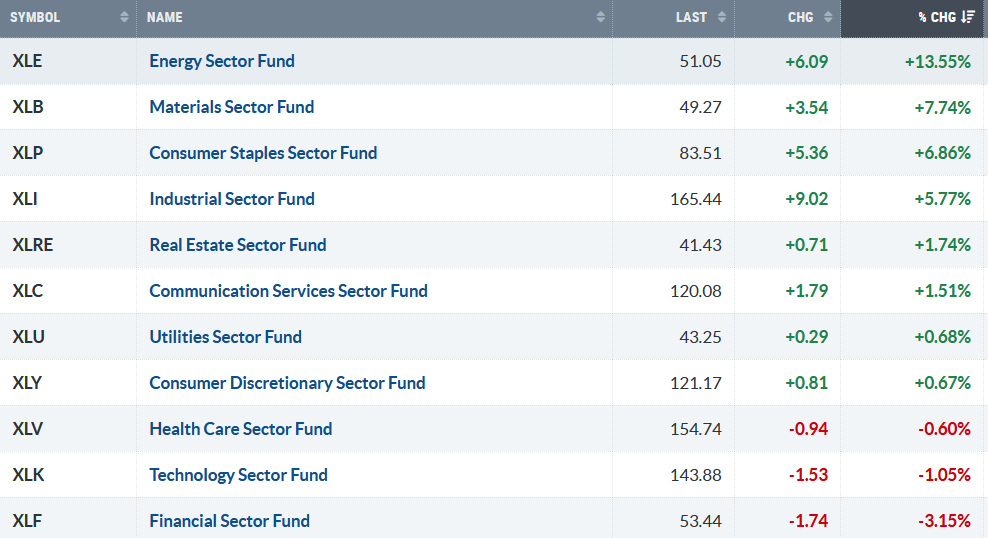
Figure 3: S&P SPDR Sector ETFs January 2026 Performance Summary
013025 SPDR Sectors MTD January
Source: Stockcharts.com
Energy and Materials led while Technology and Financials were the weakest sectors in January.
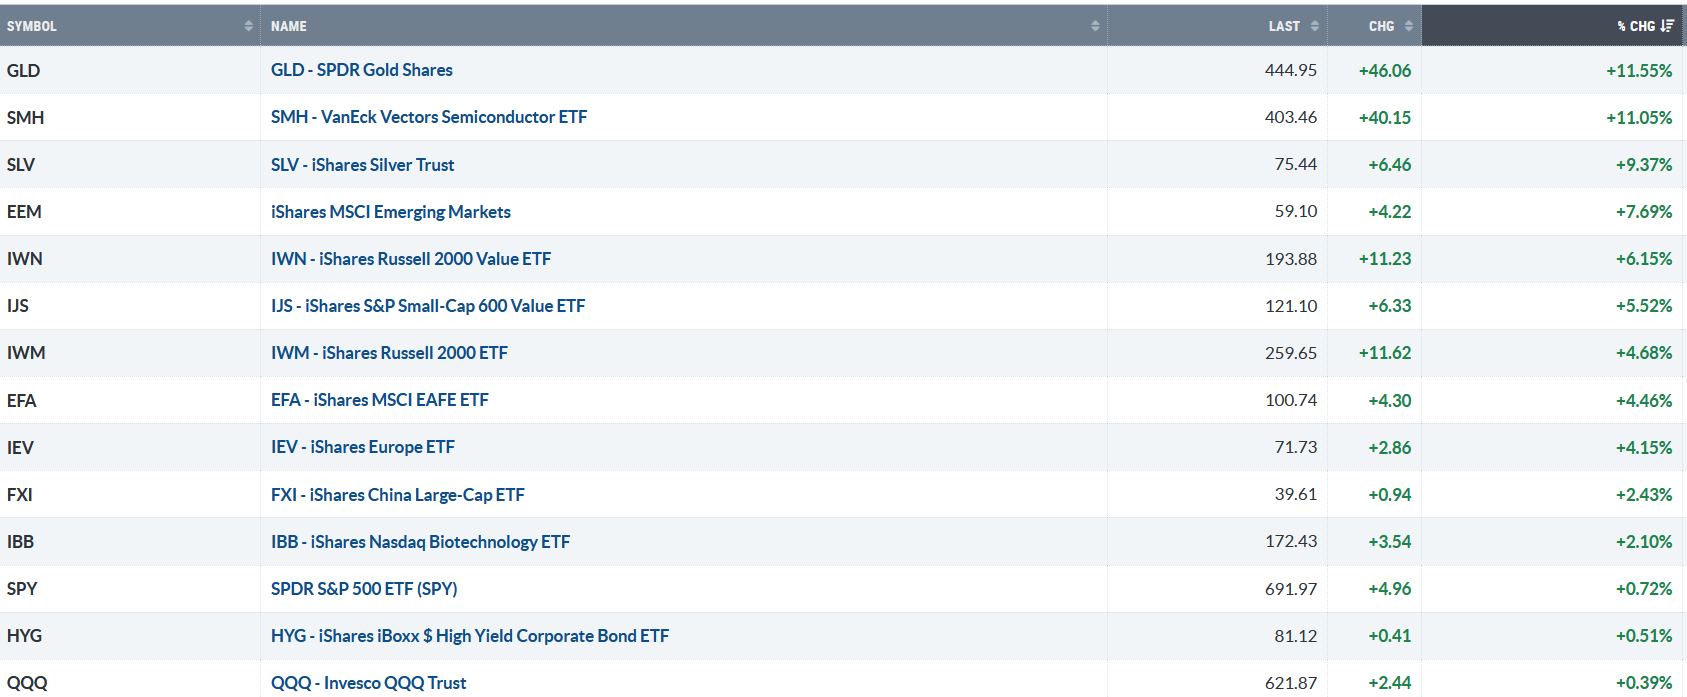
Figure 4: Bonnie’s ETFs Watch List January 2026 Performance Summary
013026 Bonnie’s ETF Watch List MTD January
Source: Stockcharts.com
Despite Friday’s sharp sell-off, Gold and Silver finished January with substantial gains. Semiconductors, International, and Small Caps (Growth and Value) all outperformed the S&P 500.
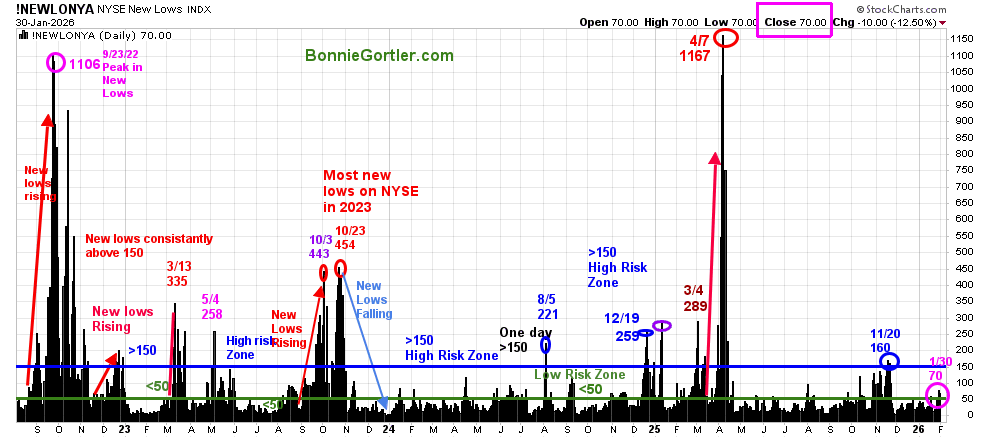
Figure 5: NYSE New Lows
013026 New Lows NYSE
Source: Stockcharts.com
New Lows are rising on the New York Stock Exchange Index, closing at 70 on 1/30/26. It would be positive in the short term if New Lows declined to between 25 and 50. On the other hand, if new lows rise above 150, it would be short-term negative with greater daily volatility and increased risk expected.
Learn more about the significance of New Lows in my book, Journey to Wealth, published on Amazon. For a chapter preview of Journey To Wealth, visit here.
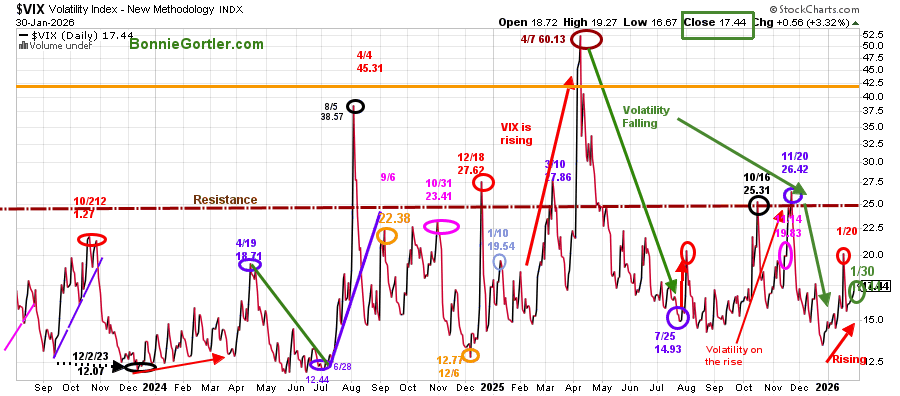
Figure 6: CBOE Volatility Index (VIX)
013026 VIX Daily
Source: Stockcharts.com
The CBOE Volatility Index (VIX), a measure of Fear, peaked on 4/7 in 2025.
The VIX has been increasing since December 2025, closing at 17.44. Two closes above 25.00 would imply a potential quick rise in VIX to 40 as investors get more cautious.
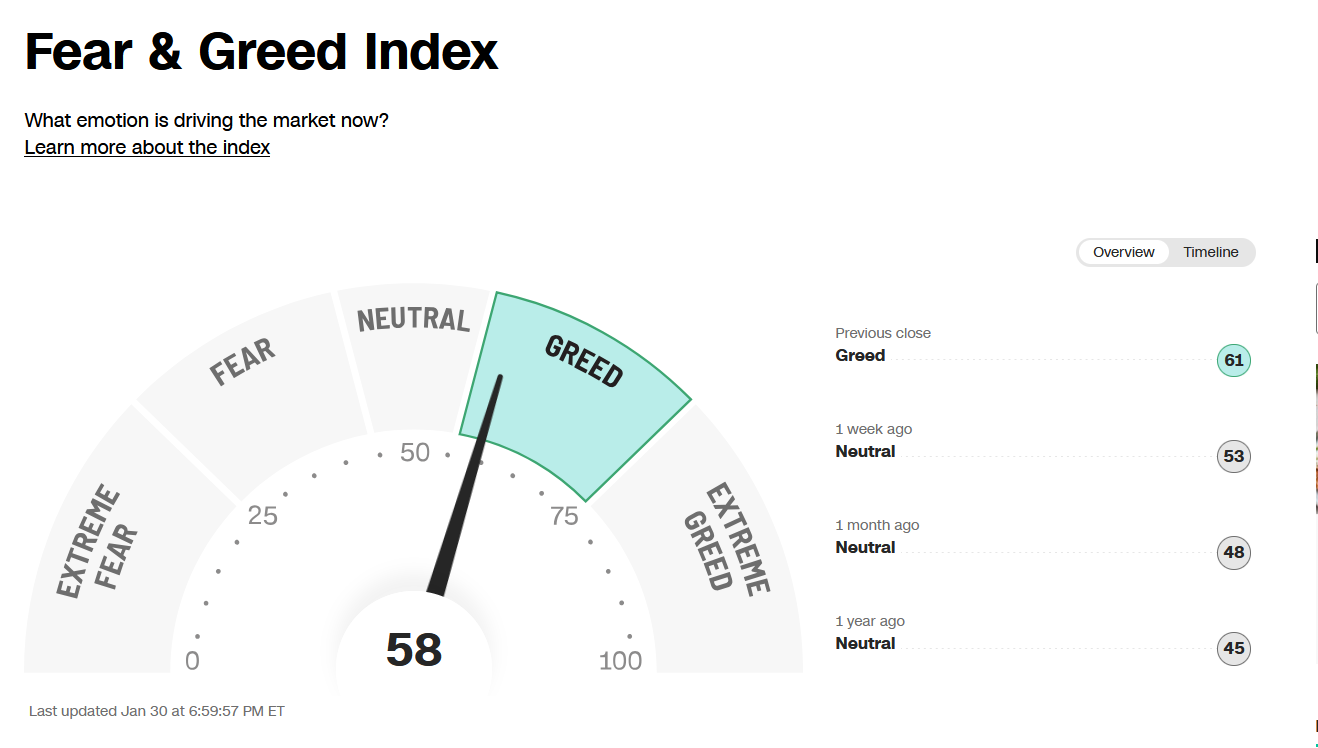
Figure 7: Fear & Greed Index
013026 CNN Fear and Greed Index
Source. CNN.com
Investor sentiment, as measured by the Fear and Greed Index (a contrarian indicator), closed at 58, a level that signals Greed. If sentiment reaches Extreme Greed, the risk of a more meaningful short-term pullback increases.
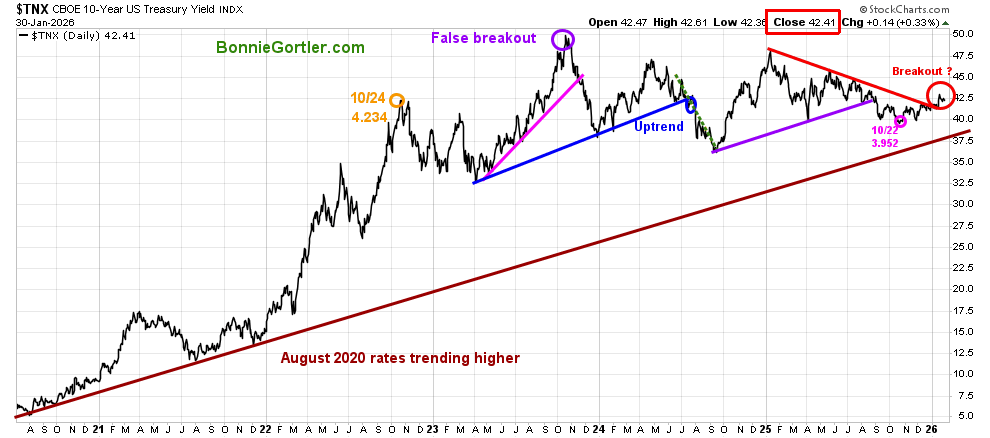
Figure 8: CBOE 10YR U.S. Treasury Yield Daily
013026 10-year U.S. Treasury Yield
Source: Stockcharts.com
The long-term yield uptrend in 10-year U.S. Treasuries, which began in August 2020, persists.
The 10-year U.S. Treasury Yield is rising, closing at 4.241%, breaking the 2025 downtrend. If yields continue rising and close above 4.30%, it could put pressure on equities in the short term. On the other hand, yields falling below 3.950% is likely to support equities.
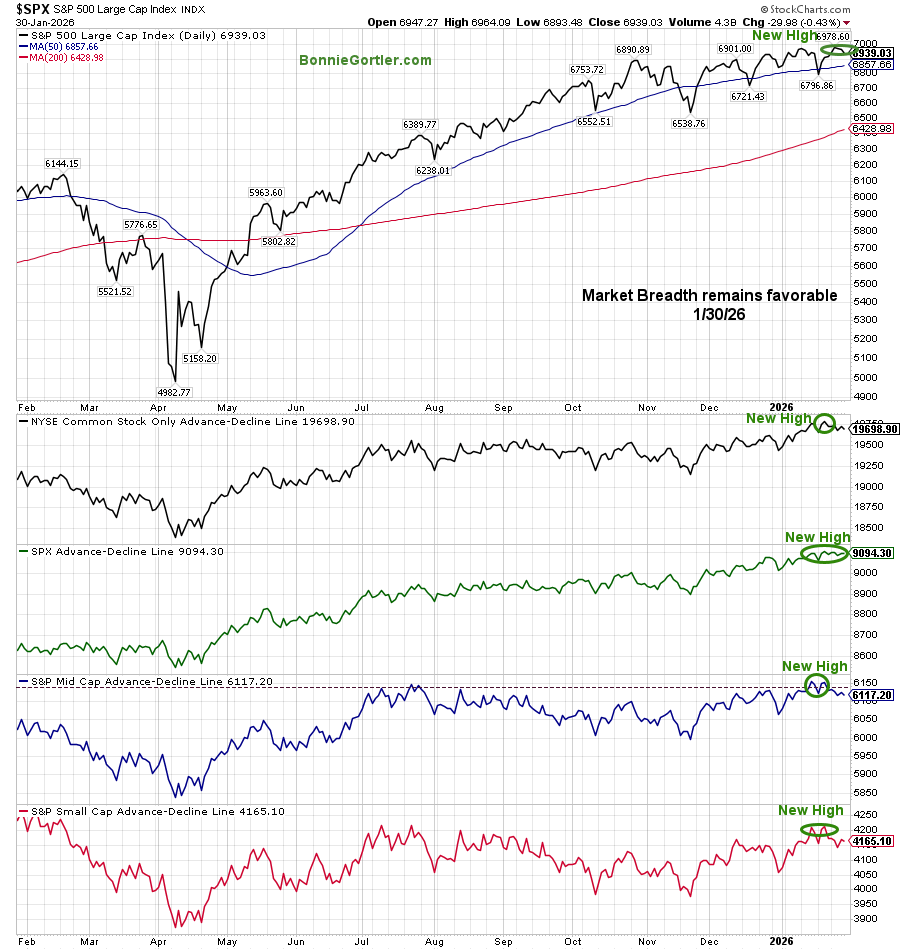
Figure 9: S&P 500 Price and NYSE, SPX, Mid and Small Cap AD Lines
013026 S&P 500 Price and NYSE Mid and Small Cap AD Lines
Source: Stockcharts.com
Market breadth remains favorable. The advance-decline line of the NYSE Common Stock Index, the S&P 500, and the S&P Mid and Small Cap indices all made new highs in January. However, the Mid and Small Cap advance-decline line has begun to weaken. Keep a close eye on market breadth in Mid and Small Caps, as it can signal whether the market is strengthening or weakening.
It would be positive for further gains in 2026 if market breadth continues to make new highs with its related averages.
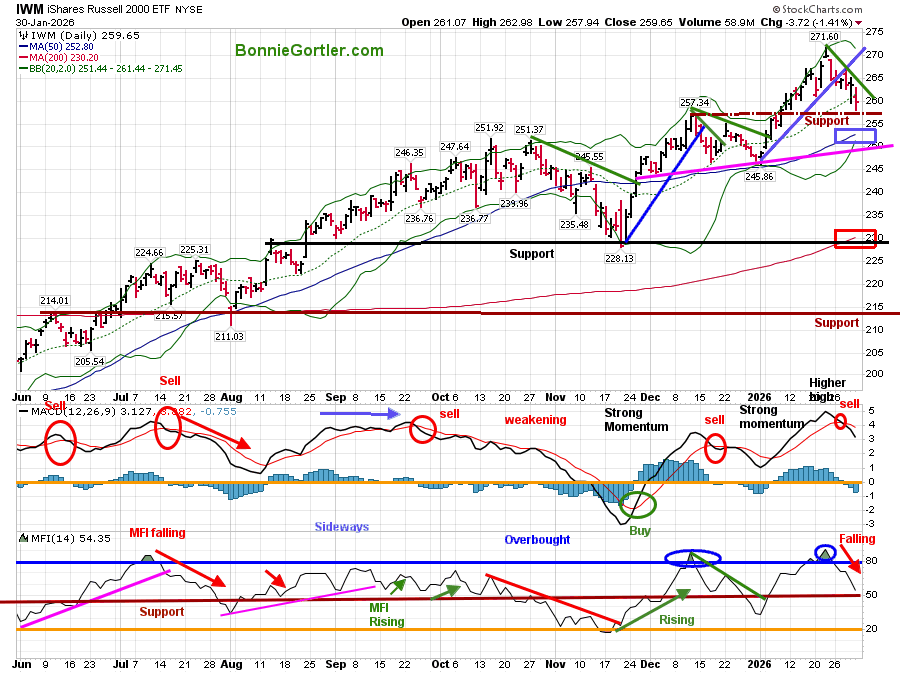
Figure 10: Daily iShares Russell 2000 (IWM) Price (Top),12-26-9 MACD (Middle), and Money Flow (Bottom)
013026 IWM Daily
Source: Stockcharts.com
The Russell 2000 (IWM) has fallen four days in a row, closing at 259.65, down -1.95% for the week, retracing toward its December 2025 high, holding support (brown dotted line), and closing above its 50-day Moving Average (blue rectangle), which is a sign of strength.
The MACD (middle chart) is on a sell signal. However, momentum confirmed the IWM price high, suggesting another rally is likely, though it may not exceed the momentum high, which would then make IWM more vulnerable to a meaningful pullback.
Watch if Small Caps can show leadership this week, outperforming the S&P 500. If so, it’s likely to fuel the broader market higher. On the other hand, Small Caps lagging the S&P 500 and closing below 251.52 would likely be short-term negative.
Learn charting strategies to help you grow your wealth in the comfort of your home in my eCourse, Wealth Through Investing Made Simple. New Module 7: Trading Alerts That Build Confidence and Reduce Risk. Learn more here.
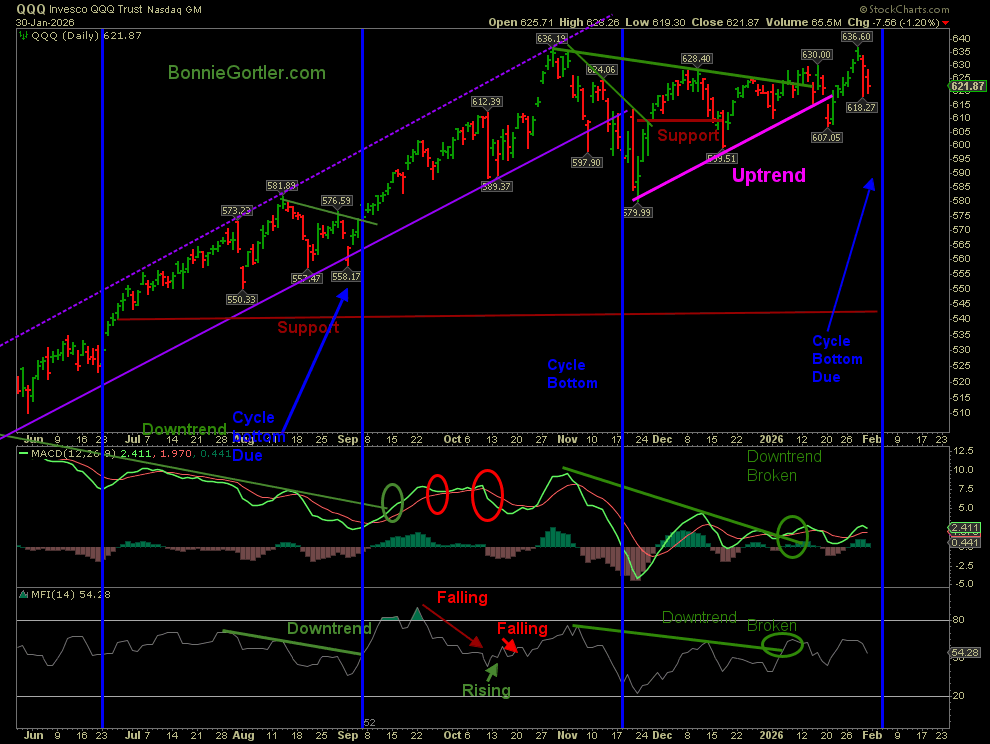
Figure 11: QQQ Daily Invesco QQQ Trust (QQQ) Price (Top),12-26-9 MACD (Middle), and Money Flow (Bottom)
013026 QQQ Daily
Source: Stockcharts.com
The chart shows the Invesco (QQQ), an exchange-traded fund based on the Nasdaq 100 Index.
QQQ fell by only 0.14% last week despite the volatility, with little change. QQQ looked poised to break out to the upside, yet there was no follow-through, as investors digested Apple, Microsoft, Meta, TSLA, and other earnings announcements.
Momentum (MACD) and Money Flow (MFI) are both falling, no clear message, staying in a range.
This week, volatility is likely to increase as the cycle bottom approaches. Two closes below 599.00 would be short-term negative. On the other hand, two closes above 627.00 would be short-term positive.
Discover how to cultivate a powerful wealth-building mindset and effective charting strategies to grow your wealth from the comfort of your own home in my eCourse, “Wealth Through Investing Made Simple,” including the New Module 7: Trading Alerts That Build Confidence and Reduce Risk. Learn more here.
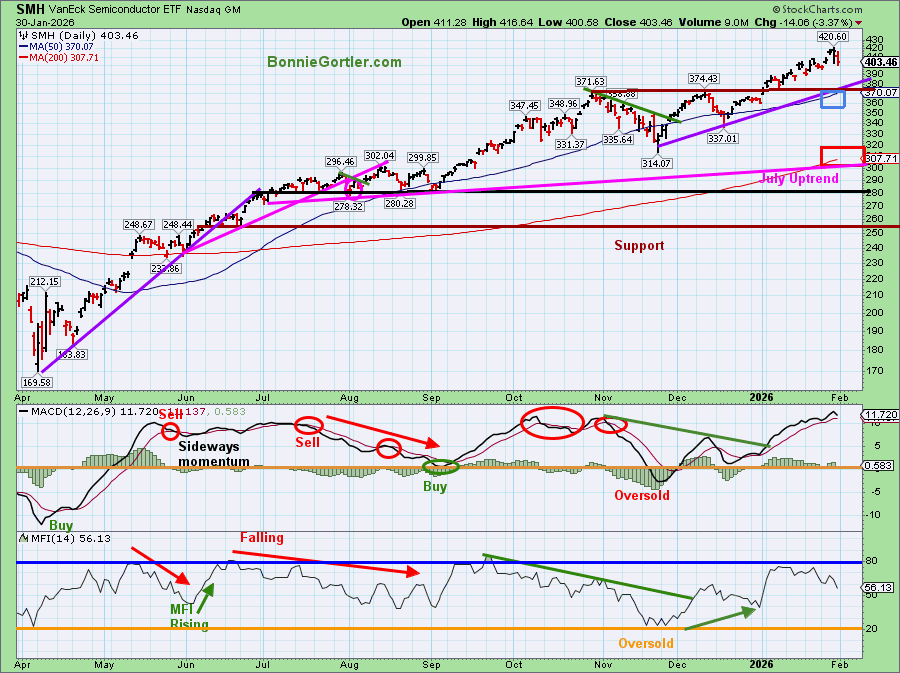
Figure 12: Daily Semiconductors (SMH) (Top), 12-26-9 MACD (Middle), and Money Flow (Bottom)
013026 SMH Daily
Source: Stockcharts.com
The top chart shows the Daily Semiconductor (SMH) ETF, which is concentrated mainly in US-based Mega-Cap Semiconductor companies. SMH can be highly volatile. SMH tends to be a leading indicator of the market when investors are willing to take on greater risk, and the opposite is true when the market is falling.
The September 2025 uptrend (purple line) remains a continuing favorable pattern of higher highs and higher lows. SMH remains above both the 50-day MA (blue rectangle) and the 200-day MA (red rectangle), indicating underlying strength.
Support is at 389.00, followed by 375.00. Resistance is at 416.00, followed by 421.00
The MACD (middle chart) remains on a buy signal, above 0, but momentum is declining.
The Money Flow (lower chart) is falling as SMH has moved higher, closing at 56.13.
If Semiconductors (SMH) were to weaken, closing two days below 375.00, it would be short-term negative and likely lead the broad market lower. For now, the bulls get the benefit of the doubt as the SMH trend is up.
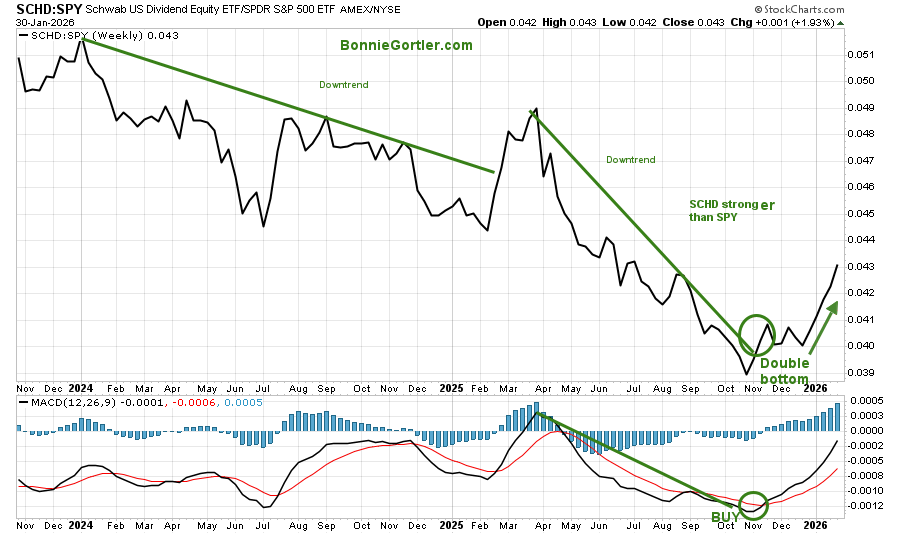
Figure 13: Schwab US Dividend Equity ETF (SCHD) /S&P 500 (SPY) Relative Strength Ratio
013026 SCHD SPY Ratio Weekly
Source: Stockcharts.com
Defensive sectors have improved, while some aggressive areas have weakened.
The Dividend Equity ETF’s relative strength ratio, SCHD/SPY, continues to rise (top chart). After breaking the March downtrend relative ratio and forming a double bottom (top chart), the MACD Buy (middle chart) and SCHD show substantial gains.
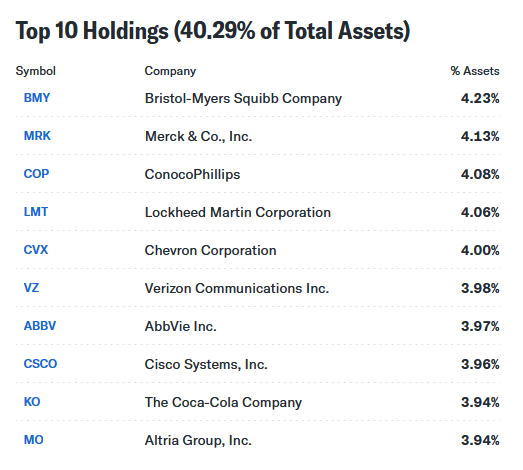
Figure 14: SCHD Top 10 Holdings
013026 SCHD holdings
Source: Yahoo Finance
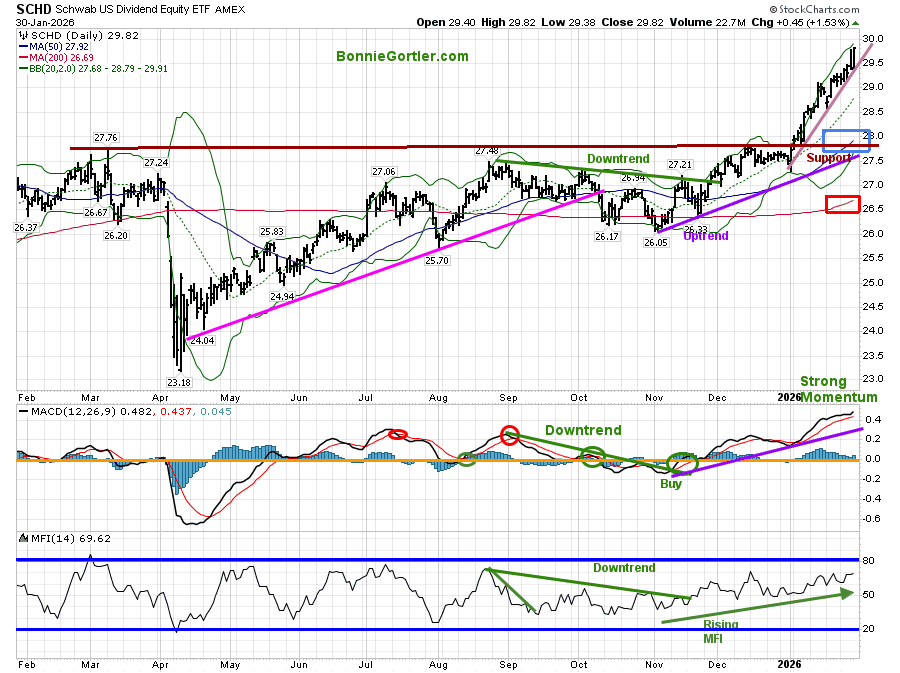
Figure 15: Schwab US Dividend Equity ETF
013026 SCHD Daily
Source: Stockcharts.com
Schwab US Dividend Equity ETF (SCHD) gives exposure to dividend-paying U.S. equities.
SCHD broke its September downtrend (green line) and attracted buyers. SCHD gained +2.23% last week and is up +8.71% in 2026.
MACD (middle chart) remains on its November buy signal, rising above 0, but has slowed after strong momentum. Money Flow has remained in an upward trend since November.
SCHD met its objective of 29.50, as mentioned in the 12/12/25 Market update. Support is 28.81, followed by 28.50. Since the first objective of SCHD has been hit and is trading near the top of the Bollinger Band, I recommend closing 1/3 of your position now, capitalizing on the gain, and placing a stop on the remaining balance at 27.50. Remember, you never go broke taking a profit.
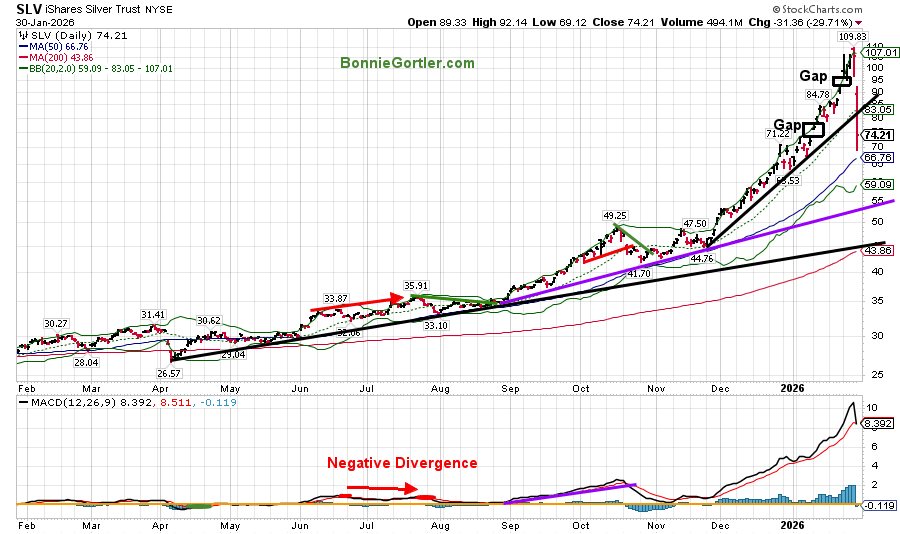
Figure 16: Silver (SLV)
013026 SLV Daily
Source: Stockcharts.com
Silver had its worst day since 1980 after a recent speculative rally. Silver (SLV) declined sharply -28.54%, (intraday down -36%), and Gold (GLD) fell -10.27% on Friday as speculative positions were unwound after their parabolic rise. Margin calls triggered forced liquidations in Silver, Gold, and other commodities as prices declined quickly. There were billions of dollars in forced sales. Over the weekend, the Chicago Mercantile Exchange (CME) raised margin requirements to slow down market volatility. Time will tell if even higher margin requirements will be necessary to stabilize precious metals. For now, volatility is likely to continue, but at a slower pace than on Friday.
Summing Up:
Despite all the volatility and the Tech earnings announcement, and the heavy selling in precious metals, the Dow fell only -0.42%, the S&P 500 was up +0.34%, and the Nasdaq fell -0.17 last week. Weekly Market breadth was slightly negative on the Nasdaq and NYSE but remains firm. Stock market volatility is likely to continue this week. Support levels remain intact on the major averages. Unless support levels break in Semiconductors, Small Caps, and New Lows on the NYSE expand by more than 150, the major averages are likely to work their way higher. Manage your risk, and your wealth will grow.
If you would like to talk about charts and get to know each other better, schedule your Free 30-minute Wealth Building Strategy Session today. Register Here.


Create more wealth in your life
with these simple strategies.
As an added bonus you will also
receive BG’s Updates and Ezine

Discover how to quickly create more well-being in your life with these simple strategies.
As an added bonus you will also
receive BG’s Updates and Ezine

As an added bonus you will receive BG’s Updates and Ezine

All work listed on BonnieGortler.com is licensed under a Creative Commons Attribution - Noncommercial - No Derivative Works 3.0 Unported License.


Free Report:
Grow and Sustain Your Wealth
Discover how to grow your money with these easy, simple steps.


One thought on “Bonnie’s Market Update 1/30/26”