

10 Simple Tips for Financial Well-Being
07/01/2026
The bears were unable to take control through the ups and downs during July and August. Normally a weak market period, the averages had a modest pullback, holding above key support levels and working off their daily overbought condition. After the short decline without much price fluctuation, the major averages formed favorable technical patterns on a daily basis from oversold conditions. The bulls stepped in to buy and the bears were disappointed once again. At the time of this writing, we remain in a rally phase that began in the end of August. The Dow, S&P 500, and Nasdaq made new record closing highs on September 12. 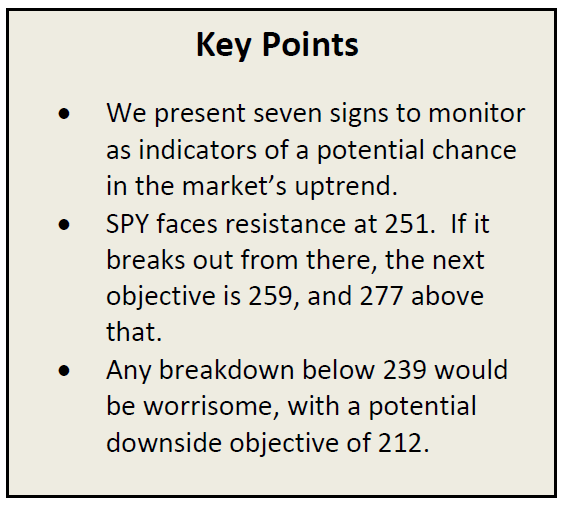
Price trends seem to be more significant indicating market direction than weakening momentum patterns. The recent rise occurred even thought there were clear negative patterns on many intermediate charts. It’s good to keep in mind, there has been not been a bear market since March 2009, when the past bear market ended. The rise in equities since then is one of the longest time periods without at least a 20 percent drop in the S&P 500.
On this latest rally there has been no big thrust in volume or surge in market breadth to suggest a strong up move is forthcoming. However, there has been no major sign of danger either. Our models remain overall neutral-positive for the intermediate term which means upside potential remains greater than downside risk. Weakening momentum patterns remain on the intermediate charts and still need to be monitored. However, until support levels and uptrends are broken look for higher prices ahead.
These clues will help guide you if the market will continue to advance or weaken.
7 Simple Clues You Want To Follow For a Potential Trend Change
Keep an eye on the S&P 500 (SPY) For a Breakout
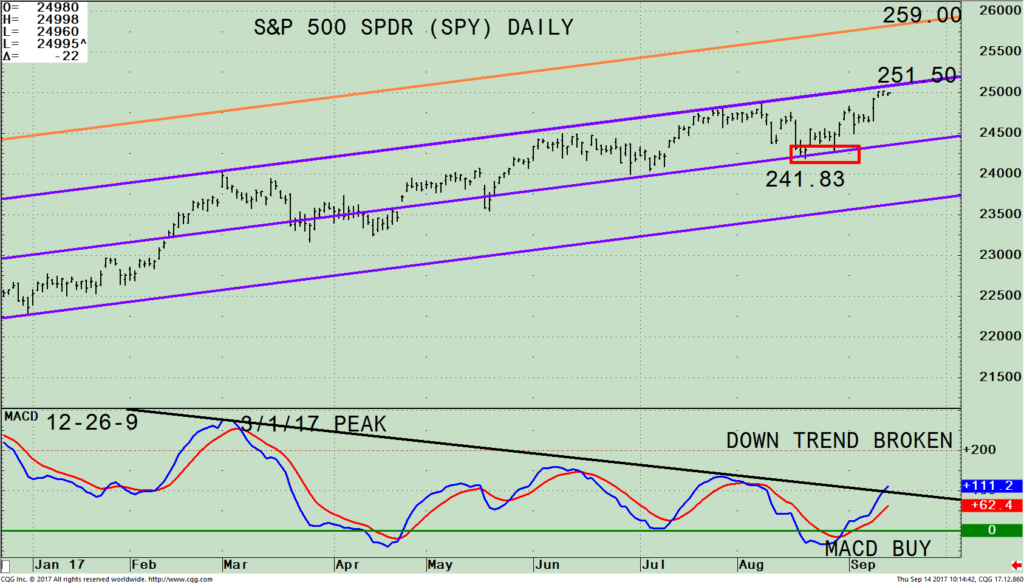
The SPDR S&P 500 (SPY) Daily Price Channel and 19-26-9 MACD
The top part of the chart is the SPDR S&P 500 (SPY) ETF and its active daily trading channel. The S&P 500 Index (SPY) is comprised of 500 stocks of the largest companies in the U.S. The S&P 500 (SPY) this week made a new all-time high. The new high coincides with hitting the daily upside channel. Further strength in the SPY now, will give a new short term channel objective to 259.00, another 3.6% higher. A break below 239.00 on a closing basis would raise a red flag.
The lower portion of the chart is the 12-26-9 MACD, a measure of momentum. MACD is on a buy since late August. MACD is above 0, rising and its pattern has room to the upside before it would be considered extended. MACD broke its daily down trend from its March 1 peak.
Higher Intermediate Term Upside Objectives For the S&P 500 (SPY)
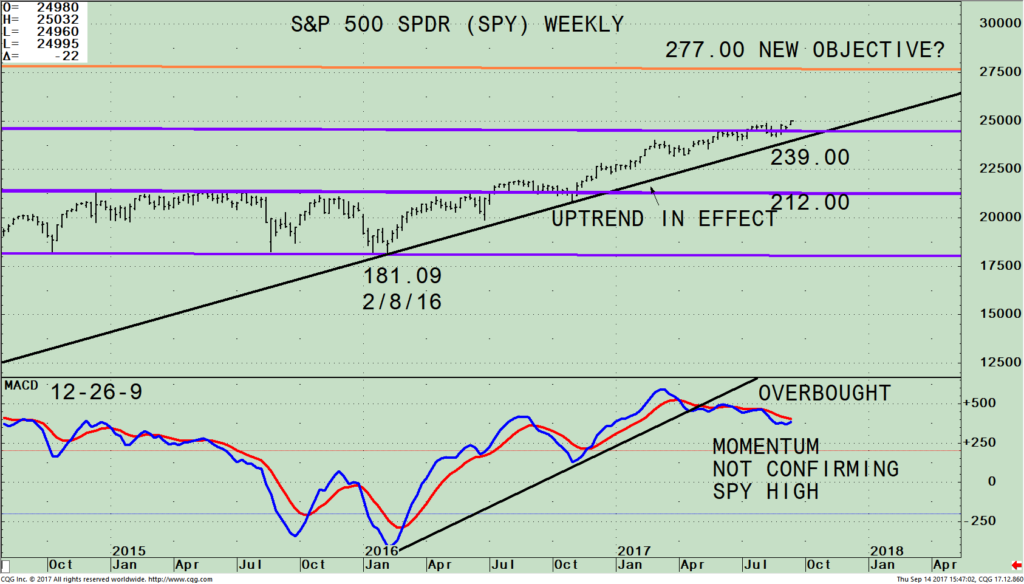
The SPDR S&P 500 (SPY) Weekly Price Channel and 12-26-9 MACD
The top part of the chart is the SPDR S&P 500 (SPY) ETF and its active weekly (intermediate) trading channel. The SPY has had a slow and steady rise this year. The SPY chart pattern has been in a consolidating pattern, with an upside bias. The SPY remains clearly in an uptrend (black line). There has not been even a minor downside penetration of the trendline since the lows were made on 2/8/16. Declines have been small and for relatively short periods of time. Until this trendline is broken, no serious threat of a major decline should occur. The upside channel objective is 277.00. Below 239.00 implies more weakness towards the middle channel at 212.00.
Summing Up:
The major averages have made new highs. However, keep in mind intermediate momentum patterns have not confirmed the recent highs. The market breadth and volume indicators that we follow have not been strong enough to generate any impulse signals that suggest the rally is sustainable and would be stronger than an average market rise. There has been no real thrust on the advancing days to get excited about, however not much ground has been given up either. Our stock market timing models remain neutral-positive, indicating a potentially profitable market climate and potential further gains over the next several weeks to months.
As long as the SPY remains above 239.00, the trend is up and the odds favor the SPY to work its way higher towards the upside channel objective at 277.00. If the SPY falls below 239.00 on a weekly close, then risk would increase, and the intermediate trend would change from up to down implying more potential weakness towards the middle channel at 212.00. Ride the trend for now. However, watch for the 7 clues for a potential trend change.
I would love to hear from you. Please call me at 516-829-6444 or email at bgortler@signalert.com to share your thoughts or ask me any questions you might have.
*******Article published by Bonnie Gortler in Systems and Forecasts September 15, 2017

If you like this article, then you will love this!
Free Instant Access to Grow
Your Wealth and Well-Being E-Book HERE
Disclaimer: Although the information is made with a sincere effort for accuracy, it is not guaranteed that the information provided is a statement of fact. Nor can we guarantee the results of following any of the recommendations made herein. Readers are encouraged to meet with their own advisors to consider the suitability of investments for their own particular situations and for determination of their own risk levels. Past performance does not guarantee any future results.


Create more wealth in your life
with these simple strategies.
As an added bonus you will also
receive BG’s Updates and Ezine

Discover how to quickly create more well-being in your life with these simple strategies.
As an added bonus you will also
receive BG’s Updates and Ezine

As an added bonus you will receive BG’s Updates and Ezine

All work listed on BonnieGortler.com is licensed under a Creative Commons Attribution - Noncommercial - No Derivative Works 3.0 Unported License.


Free Report:
Grow and Sustain Your Wealth
Discover how to grow your money with these easy, simple steps.

