

10 Simple Tips for Financial Well-Being
07/01/2026
“If you have trouble imagining a 20% loss in the stock market, you shouldn’t be in stocks.” ~John (Jack) Bogle
The stock market in 2013 had its best gains since the 90’s with the US equity markets up more than 25% and many of the major indexes hitting new highs as the year progressed. Many international markets were strong as well, with the exception of the emerging markets and gold.
Bonds had a negative total return for the year with the Vanguard Bond market average down over 2.3%, the first yearly loss since 1999 when it lost 0.76%. Municipal bonds were especially weak. Treasury yields rose more than a full percent which had a negative impact on preferred stocks, and real estate investment trusts (REITs).
The market had an incredible year of gains, but many of the market indices are situated where tops could take place rather than a bottom. This is not to say we will not rally further, but I do not expect double digit gains in 2014 from where we are now after successive years of gains.
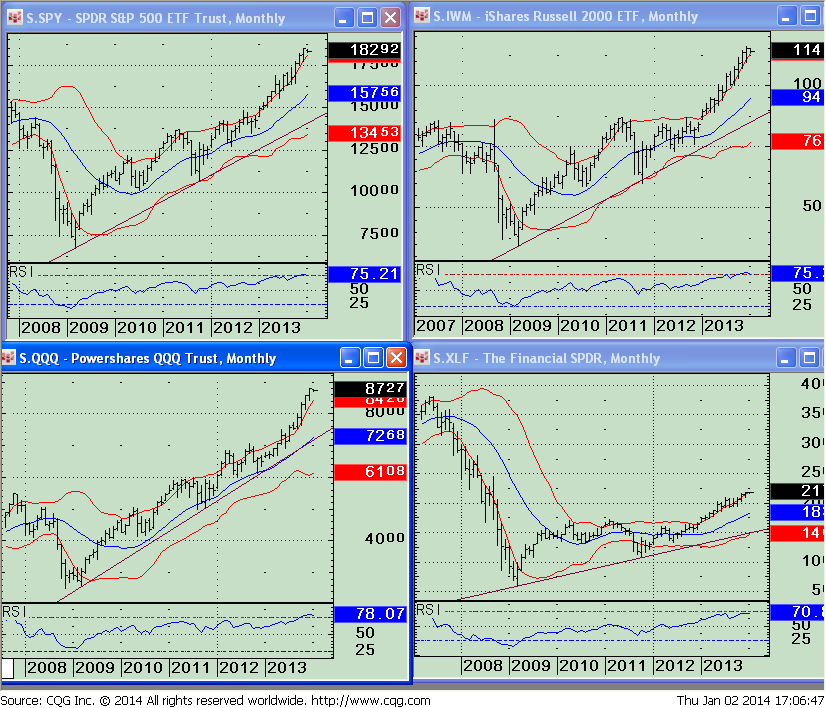
One of my favorite momentum indicators is the RSI Index (Relative Strength Index) by J. Welles Wilder Jr. The oscillator ranges from 0 – 100. The RSI Index is considered overbought at 70 and oversold at 30. Extremely high or low readings are potentially early signs of a pending market top or market bottom. Notice all charts are above the 70 level. The RSI indicator can be used on individual stocks, ETF’s or other stock market vehicles. As with MACD, it is a very useful to consider not only the level of the indicator, but also whether there are any positive or negative divergences with price levels.
The most recent market rally has propelled the 14-month RSI to extremely high levels for the key ETFs in the charts below (SPY, IWM, QQQ, XLF). All of these ETFs are in long term uptrends which began from the lows of 2008-2009.
Where do we stand now on the long term monthly charts of some of the key ETFs?
Top Left Chart—SPY Monthly: The S&P 500 continues to trade at the top of its monthly Bollinger band, another useful technical analysis indicator by John Bollinger. The band is plotted two standard deviations away from a simple moving average. Bollinger bands adjust to the market and are a measure of volatility. When the market becomes more volatile, the bands widen and when the market becomes less volatile they contract. The S&P 500 is a little above its upper band, overbought, not in a safe point to make new purchases. Notice on the chart how we normally don’t go much higher in price when the top band is hit, and price declines occur after touching the top band or we trade along it. This could occur again. Support is at approximately 157.50. In addition, RSI is also at a high reading at 77.53. The last time we had this high reading was in May 2007.
Bottom Left Chart—QQQ Monthly: The PowerShares QQQ (ETF) is an exchange-traded fund based on
The Nasdaq-100 Index. The Index includes 100 of the largest domestic and international nonfinancial companies listed on the Nasdaq Stock Market based on market capitalization. The monthly RSI reading is overbought at 79.86, the highest reading since October 2007 at 78.80.Support for QQQ is at approximately $72.00/share.
Top Right Chart—IWM Monthly: The iShares Russell 2000 ETF is very liquid, commonly used by day traders and investors for representation of small-cap stocks in their portfolio. The monthly RSI reading is 77.62, overbought, the highest reading since April 2011 at 68.66. Support for IWM lies at approximately 95.00.
Bottom Right Chart—XLF daily: The Index includes a broad range of financial service firms including banks, brokerage houses, insurance and other diversified financial holding companies. The stock market does well when financials are leaders. Keep an eye out if financial are weaker than the broad market for a potential warning of a top. We are hugging the upper Bollinger Band. The monthly RSI reading is 71.82, slightly overbought, the highest reading since June 2007 at 77.12.
Just to sum up:
All in all it was a great year to be invested in US equities with most averages having big gains and with very few pullbacks taking place. Favorable holiday seasonality at the end of December is over after a strong close to the year. We could have some profit taking to start the New Year off in the short term, since we are overbought and the S&P 500 had no 10% pullback in 2013 which is rare historically.
The long term trend is up, although extended based on my interpretation of two technical indicators, RSI and the position of the Bollinger bands. Our models remain favorable, volatility is low and support levels have held as the market has gone higher. Traders are returning from their time off, institutions are rebalancing their portfolios so it’s normal for some added volatility. I continue to give the benefit of the doubt to the bulls but it could be a little bit of a bumpy ride to start the beginning of the year. If we do decline from here, I would like to see the S&P 500 (SPY) hold the daily support levels at 170 mentioned in the December 20, 2013 newsletter and the iShares Russell 2000 Index at 107.50. If we break support then we could fall to the monthly support levels mentioned above. It’s a good idea to make a plan now that has an exit strategy for your investments like we have for our managed accounts so you will not to get caught in the market if a substantial decline takes place as the year progresses.
I invite you to contact me with any comments or insights, and to share your own favorite charts and indicators with me. Email: bgortler@signalert.com; phone: 1-800-829-6229
Here is a special offer to receive a
FULL YEAR OF SYSTEMS & FORECASTS NEWSLETTER
at a SPECIAL DISCOUNT – $99
This is a hypothetical result and is not meant to represent the actual performance of any particular investment. Future results cannot be guaranteed.
Although the information is made with a sincere effort for accuracy, it is not guaranteed either in any form that the above information is a statement of fact, of opinion, or the result of following any of the recommendations made herein. Readers are encouraged to meet with their own advisors to consider the suitability of investments discussed above for their own particular situations and for determination of their own risk levels.
To discover how to achieve your financial dreams click here
Visit www.BGJourneyToWealth.com for more insights to growing your wealth!
Like this post? Feel free to use it in your blog or ezine as long as you use the above signature in its entirety


Create more wealth in your life
with these simple strategies.
As an added bonus you will also
receive BG’s Updates and Ezine

Discover how to quickly create more well-being in your life with these simple strategies.
As an added bonus you will also
receive BG’s Updates and Ezine

As an added bonus you will receive BG’s Updates and Ezine

All work listed on BonnieGortler.com is licensed under a Creative Commons Attribution - Noncommercial - No Derivative Works 3.0 Unported License.


Free Report:
Grow and Sustain Your Wealth
Discover how to grow your money with these easy, simple steps.

