

Building Confidence Through Financial Awareness
06/01/2026
The U.S. and international markets came under selling pressure on Friday. For the week, only four of the eleven S&P SPDR sectors closed higher. Energy (XLE) and Health Care (XLV) were the strongest, while Real Estate (XLRE) and Consumer Discretionary (XLY) were the weakest. The SPDR S&P 500 ETF Trust (SPY) rose +0.21%.
S&P SPDR Sector ETFs Performance Summary 5/08/26-5/15/26

051526 SPDR Sectors
Source: Stockcharts.com
Figure 2: Bonnie’s ETFs Watch List Performance Summary 5/08/26-5/15/26
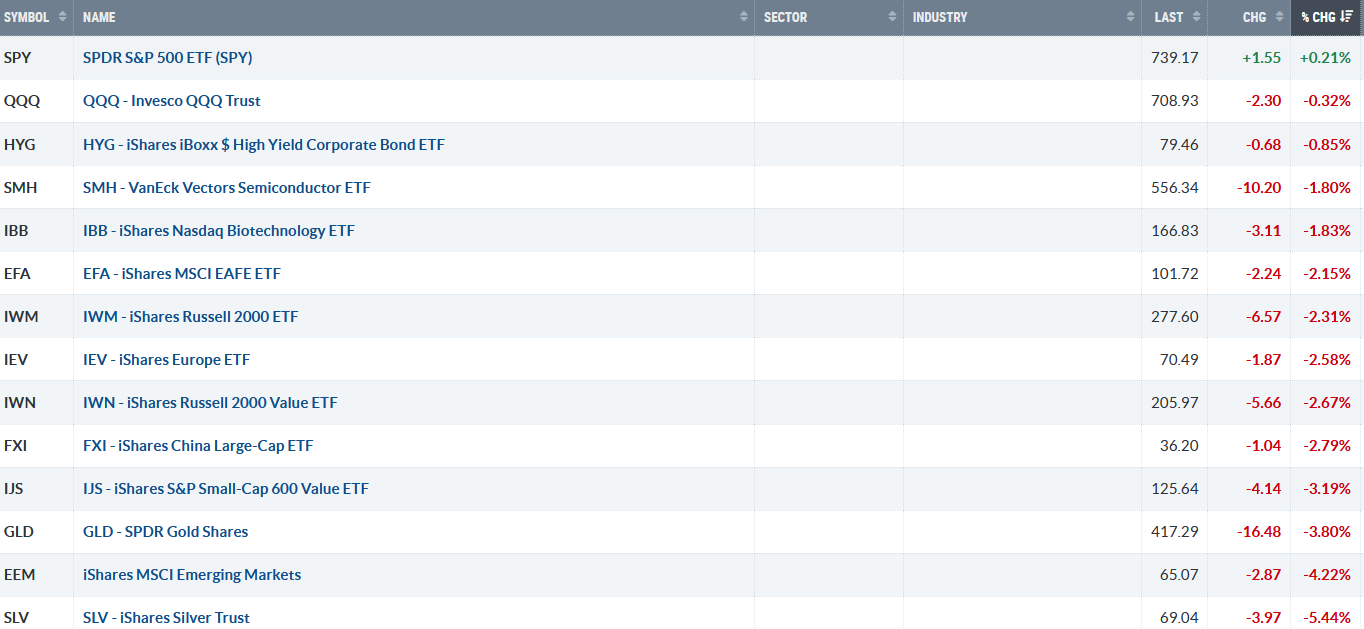
051526 Bonnie’s ETF Watch List
Source: Stockcharts.com
A broad decline last week, Silver, Gold, Emerging Markets, China, Europe, Small Cap Growth, and Small Cap Value were all weaker than the S&P 500.
Figure 3: NYSE New Lows
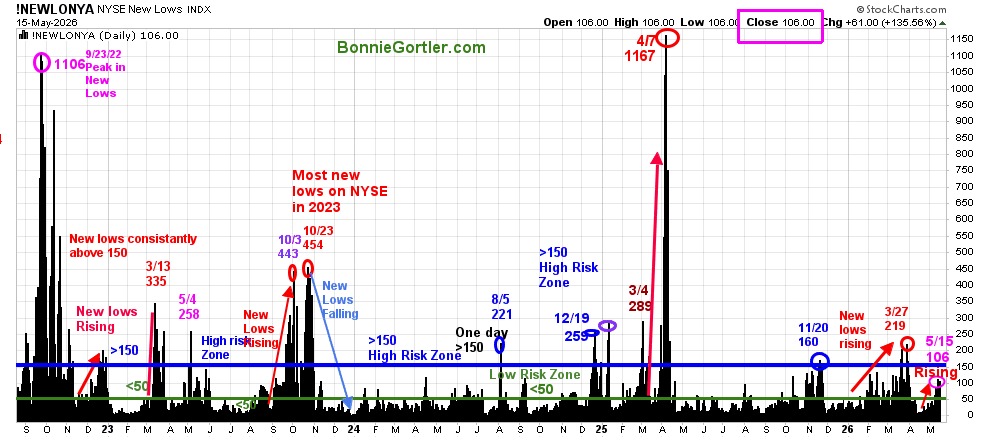
051626 New Lows NYSE
Source: Stockcharts.com
On March 27, the New lows peaked at 219 on the New York Stock Exchange Index, entering the high-risk zone, and then immediately contracted in early April. In May, once again, New Lows are rising, closing at 108. If new lows continue to rise above 150 and remain, it would be a short-term negative. On the other hand, it would be positive if New Lows fell below 50.
Learn more about the significance of New Lows in my book, Journey to Wealth, published on Amazon.
For a chapter preview of Journey To Wealth, visit here.
Figure 4: CBOE Volatility Index (VIX)
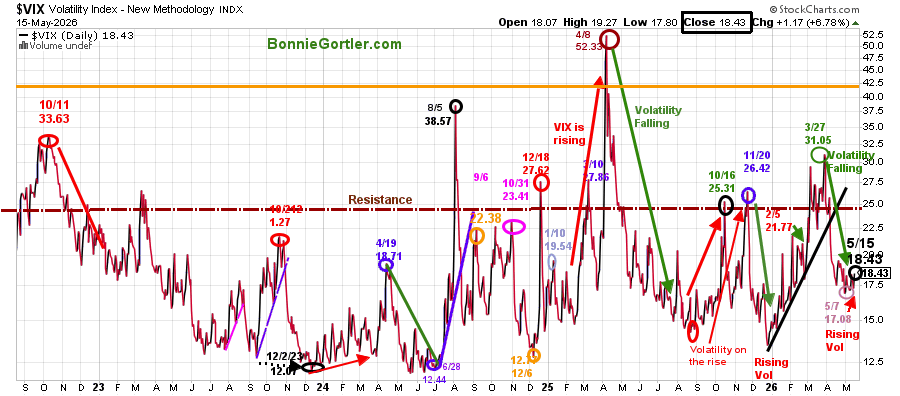
051526 VIX
Source: Stockcharts.com
The CBOE Volatility Index (VIX), a measure of Fear, is trending higher from a historical low VIX in the first quarter of 2026. VIX rose to 18.43 last week, but nothing suggests a serious decline is underway yet. Two closes above 25.00 would imply selling pressure in the short term and more daily volatility.
Figure 5: Fear & Greed Index
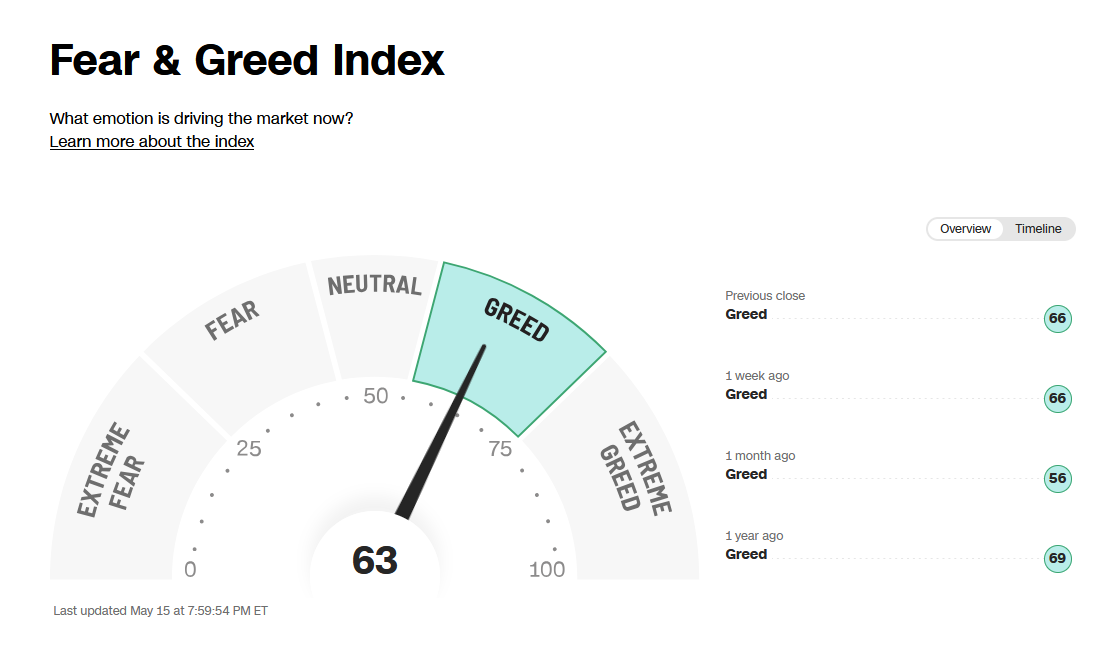
051526 CNN Fear and Greed Index
Source: CNN.com
The Fear and Greed Index, investor sentiment (a contrarian indicator), fell from 66 the previous week to close at 63, remaining in Greed but not yet showing Extreme Greed, where the risk of a severe pullback is more likely.
Figure 6: CBOE 10YR U.S. Treasury Yield Daily
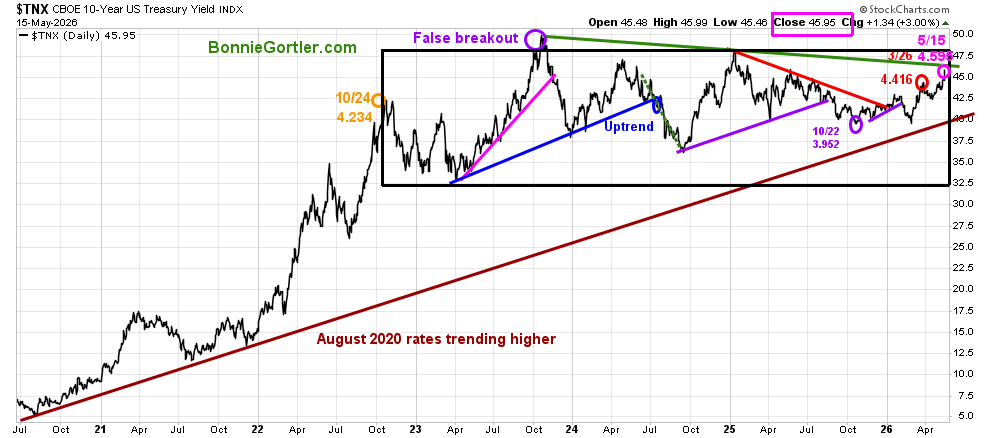
051526 $TNX – CBOE 10-Year US Treasury Yield
Source: Stockcharts.com
The U.S. Bond Market is pricing in higher interest rates.
The 10-year U.S. Treasury yield rose to close at 4.595%, remaining within its trading range since October 2022.
Figure 7: CBOE 30 YR U.S. Treasury Yield Weekly (Top),12-26-9 MACD (Middle), and 20 – YR Treasury Bond ETF (Bottom)
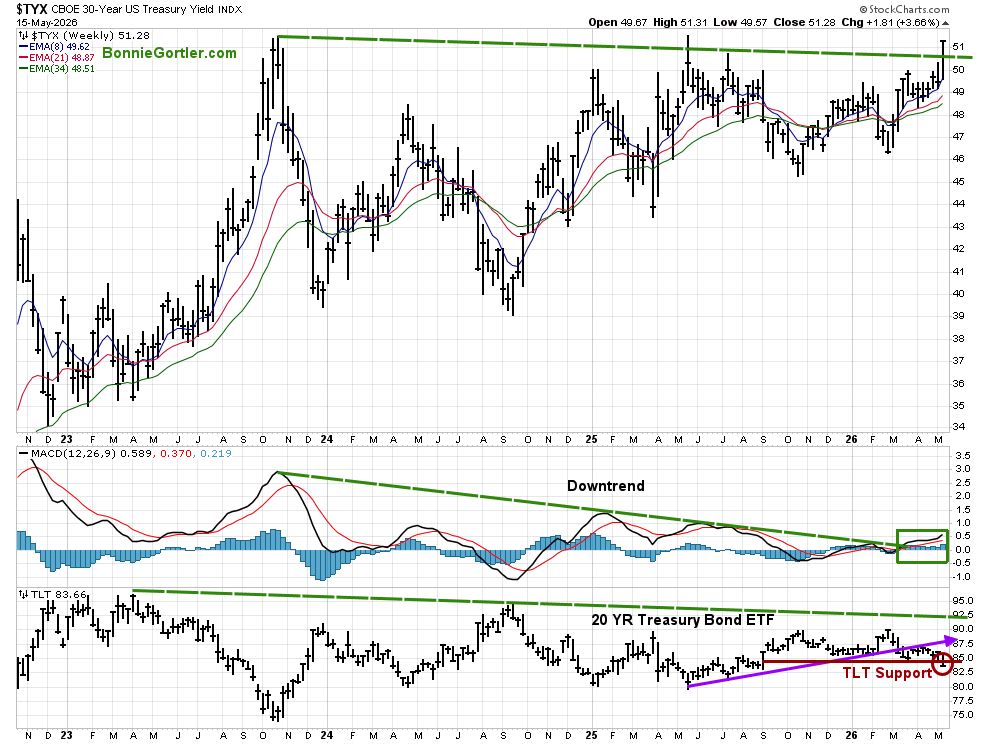
051526 30-Year US Treasury Yield and TLT
Source: Stockcharts.com
The Weekly 30-Year Treasury Yield (top chart) broke the downtrend from October 2023. Yields hit their highest level since May 2025 and closed at their highest level since 2007, an important development to watch. See the long-term chart and other charts here,
The Weekly 20-Year Treasury Bond ETF (bottom chart) moves in the opposite direction of yields and closed below September 2025 support, which is worrisome.
If long-term yields continue to rise, more pressure on equities in the short term is likely.
Figure 8: S&P 500 Price and NYSE, SPX, Mid and Small Cap AD Lines
Source: Stockcharts.com
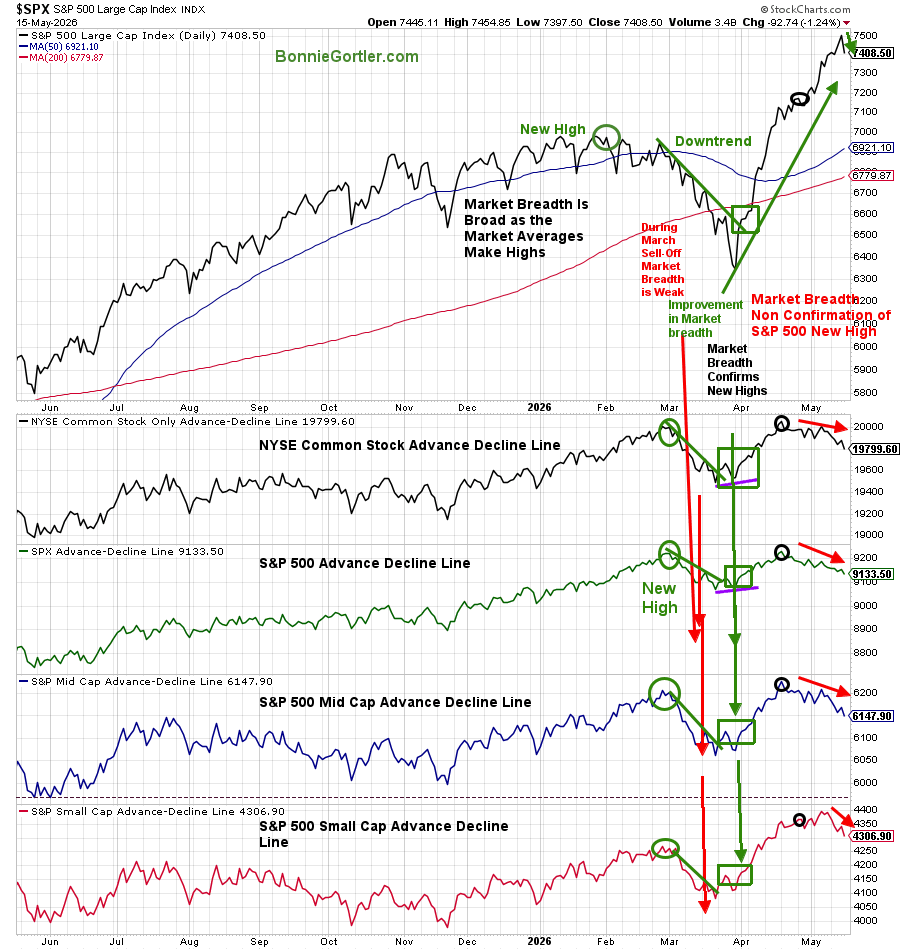
051526 S&P 500 Price and NYSE, SPX, Mid and Small Cap AD Lines
The S&P 500 made a new high, with unconfirmed market breadth as measured by the Advance-Decline line of the NYSE Common Stock Index, the S&P 500, and the S&P Mid and Small Cap Index (arrows in red). Keep a close eye on market breadth. A turn up would be positive; continued weakness would be negative in the short term.
Figure 9: Daily iShares Russell 2000 (IWM) Price (Top),12-26-9 MACD (Middle), and Money Flow (Bottom)
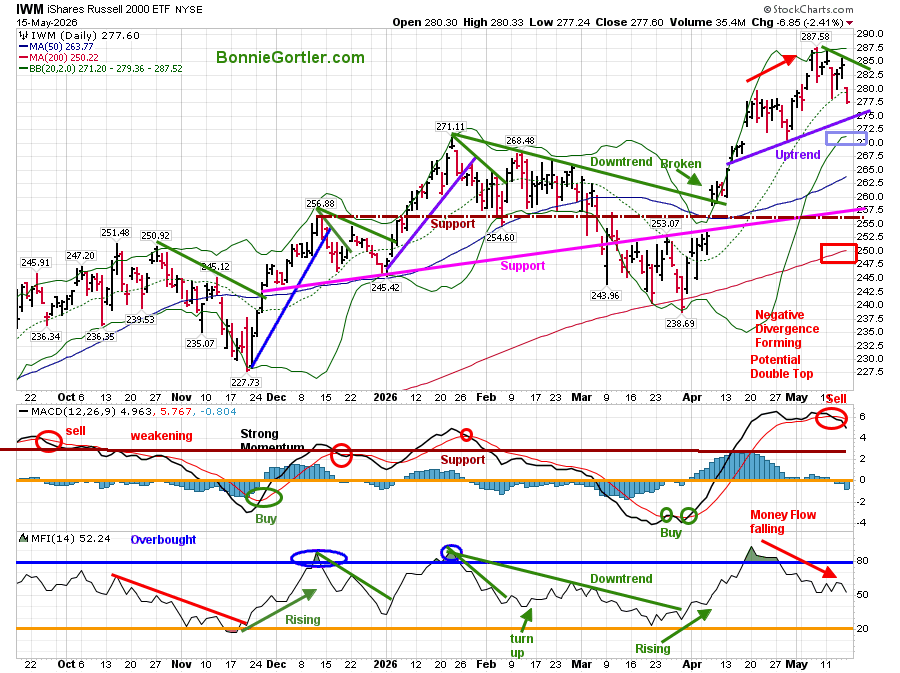
051526 IWM Daily
Source: Stockcharts.com
IWM broke the daily downtrend in January (green line) and has moved sharply higher. IWM closed above its 50-day Moving Average (blue rectangle) and the 200-day MA (red rectangle), a constructive technical pattern.
Last week, the Russell 2000 (IWM) closed at 277.60, near its Friday low, down -2.31%, and is no longer a relative strength leader. The April uptrend (purple line) is at risk of being broken if IWM closes below 275.00.
Support is at 270.00, followed by 265.00. Resistance is at 280.00, followed by 286.00.
The MACD (middle chart) generated a fresh sell signal last week after becoming overbought above 0 and is now falling following a negative divergence, a bearish pattern.
The Money Flow (lower chart) has been falling since reaching an overbought level above 80.
With yields rising, MACD on a sell signal after a negative divergence, and Money Flow falling, IWM could continue to fall towards support at 265.00 and the 50-Day MA at 263.77 as of Friday, 5/15. An upside reversal through resistance at 286.00 would be positive.
Learn charting strategies to help your short and intermediate trading in the comfort of your home in my eCourse, Wealth Through Investing Made Simple. Learn more here.
Figure 10: QQQ Daily Invesco QQQ Trust (QQQ) Price (Top),12-26-9 MACD (Middle), and Money Flow (Bottom)
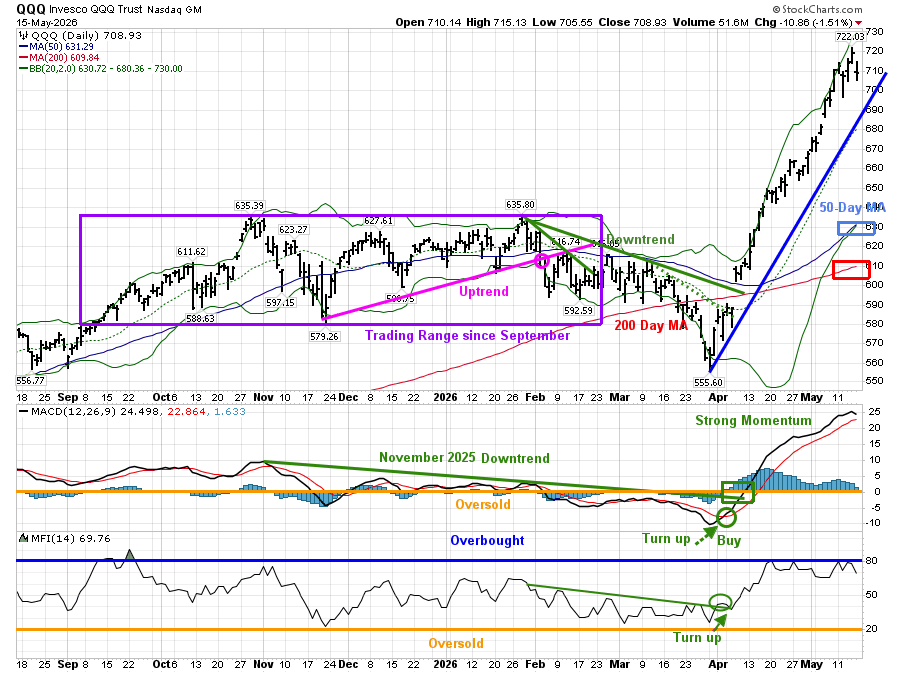
051526 QQQ Daily
Source: Stockcharts.com
The Daily chart shows the Invesco (QQQ), an exchange-traded fund based on the Nasdaq 100 Index. QQQ fell -0.32% last week, despite Friday’s decline of -1.51%.
QQQ remains in a daily uptrend from March 2026 (blue line) and an intermediate uptrend (chart not shown). QQQ closed above its 50-day Moving Average (blue rectangle) and above its 200-day MA (red rectangle), an encouraging sign.
The MACD (middle chart) has shown strong momentum during the explosive advance since March. MACD has turned down from an extreme overbought reading, but has not yet generated a sell signal.
Money Flow (MFI bottom chart) rose in March and has moved sideways since April, an encouraging sign as long as it stays above 60.
Support is at 696.00, followed by 690.00. Resistance is at 722.00. The uptrend remains in effect, but momentum has clearly begun to slow.
Figure 11: QQQ Weekly Invesco QQQ Trust (QQQ) Price (top) and 12-26-9 MACD Bottom)
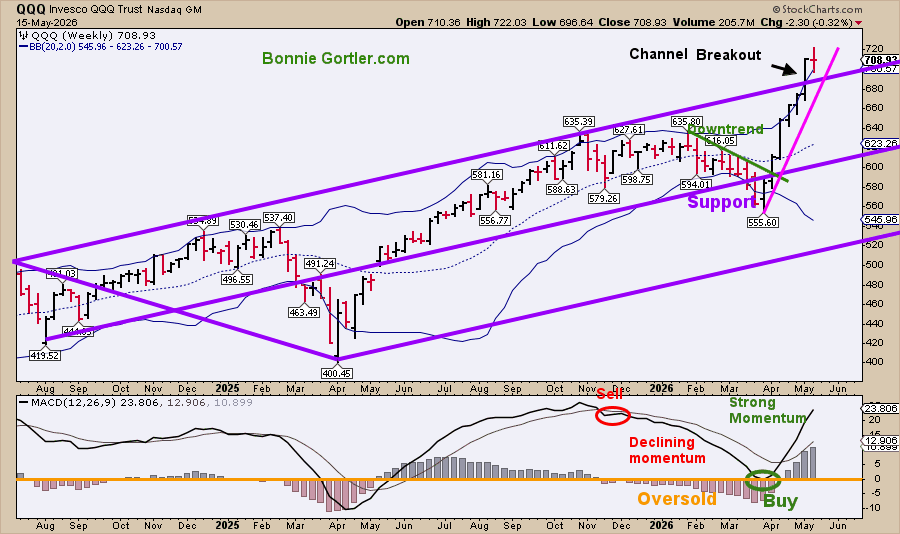
051526 QQQ Weekly
Source: Stockcharts.com
QQQ remains in an intermediate uptrend, with higher highs and higher lows, a positive pattern. QQQ has broken out of its channel, giving an upside objective to 790.00. A close below 660.00 would negate the upside objective.
MACD remains on an intermediate buy signal with momentum rising.
Summing Up:
Tops take longer to form than bottoms. The daily and intermediate trends remain up. MACD has confirmed the high in QQQ on both daily and intermediate time frames. A period of consolidation may occur, testing the intermediate channel breakout before further gains ahead.
Figure 12: Daily Semiconductors (SMH)
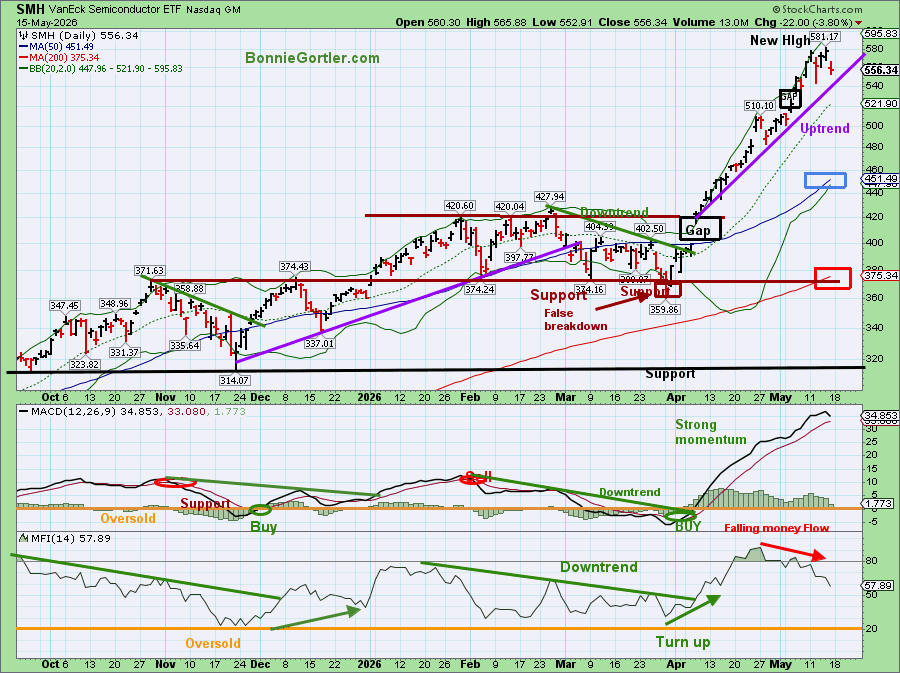
051526 SMH Daily
Source: Stockcharts.com
The top chart shows the Daily Semiconductor (SMH) ETF, which is concentrated mainly in US-based Mega-Cap Semiconductor companies. SMH can be highly volatile. SMH tends to be a leading indicator of the market when investors are willing to take on greater risk, and the opposite is true when the market is falling.
SMH fell only -1.80% last week, even with Friday’s decline of -3.80%, remaining in an uptrend from April 2026 (purple line), closing above its 50-day Moving Average (blue rectangle), and 200-day MA (red rectangle), a positive longer-term setup.
MACD (middle chart) remains on a buy signal, showing strong momentum from April, and is now extremely overbought, but no sell signal has occurred.
Money Flow (MFI bottom chart) peaked in April as SMH made a new high. However, MFI has continued to fall, a sign that money is rotating out of Semiconductor stocks.
Support is at 542.00, followed by 510.00 and 480.00. Resistance is at 565.00 and 581.00.
Both the daily and weekly charts remain in price uptrends. The strong momentum of the advance has started to wane. Watch SMH if support holds at 542.00 on a decline, or if SMH turns up early in the week and breaks through resistance at 581.00, leading the market higher. Volatility is likely this week, as investors await NVDA’s earnings results after the close on Wednesday, May 20. Their earnings report sets the tone for AI, Semiconductors, and the Nasdaq.
Summing Up:
It bears watching that longer-term bond yields rose sharply on Friday amid concerns about inflation, rising oil prices, and a growing annual deficit, whether it’s temporary or will reverse quickly. Heavy selling occurred across the U.S. market, Gold, Silver, Emerging Markets, and other global markets. The technical picture shows market internals weakening, which makes sense given the strong run-up since March. The primary trend remains positive, but market conditions are becoming more selective. Last week, the S&P 500 hit an all-time high, led by mega-caps, which are heavily weighted in the index. Price trends of the major averages remain in daily and weekly uptrends, with Semiconductors and Technology leading the market higher. If they decline and are no longer leaders, and longer-term yields continue to rise, the risk of a more serious pullback could increase rapidly. With New Lows on the New York Stock Exchange not in a high-risk zone, support levels holding, and solid earnings reports, it’s not time to panic, but it is time to review your portfolio to see if you are overexposed to any one sector, and whether adjustments are necessary. Manage your risk, and your wealth will grow.


Create more wealth in your life
with these simple strategies.
As an added bonus you will also
receive BG’s Updates and Ezine

Discover how to quickly create more well-being in your life with these simple strategies.
As an added bonus you will also
receive BG’s Updates and Ezine

As an added bonus you will receive BG’s Updates and Ezine

All work listed on BonnieGortler.com is licensed under a Creative Commons Attribution - Noncommercial - No Derivative Works 3.0 Unported License.


Free Report:
Grow and Sustain Your Wealth
Discover how to grow your money with these easy, simple steps.

