
Simple Ways to Care for Yourself
10/01/2026

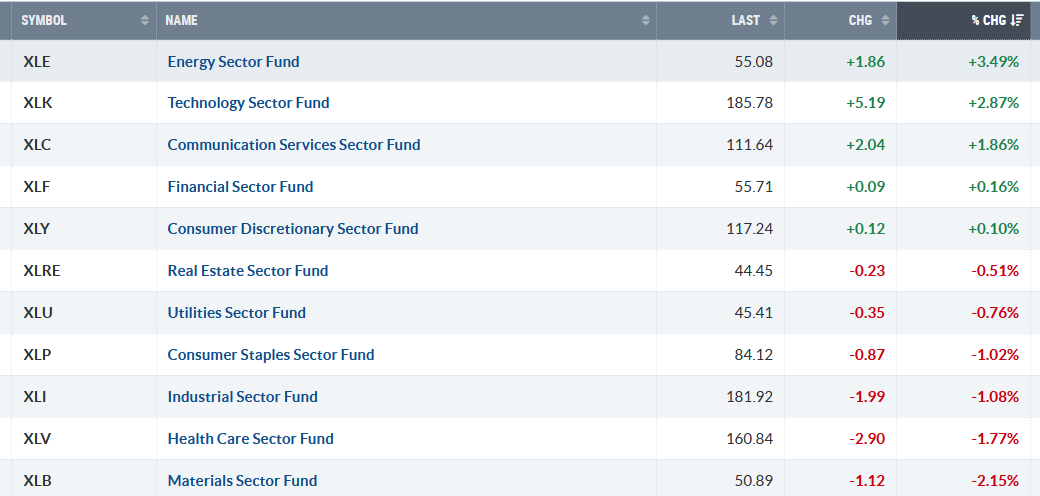
A quiet market to end the week. For the week, only five of the eleven S&P SPDR sectors closed higher. Energy (XLE) and Technology (XLK) were the strongest, while Health Care (XLV) and Materials were the weakest. The SPDR S&P 500 ETF Trust (SPY) rose +1.37%.
S&P SPDR Sector ETFs Performance Summary 7/06/26-7/10/26
071026 SPDR Sectors
Source: Stockcharts.com
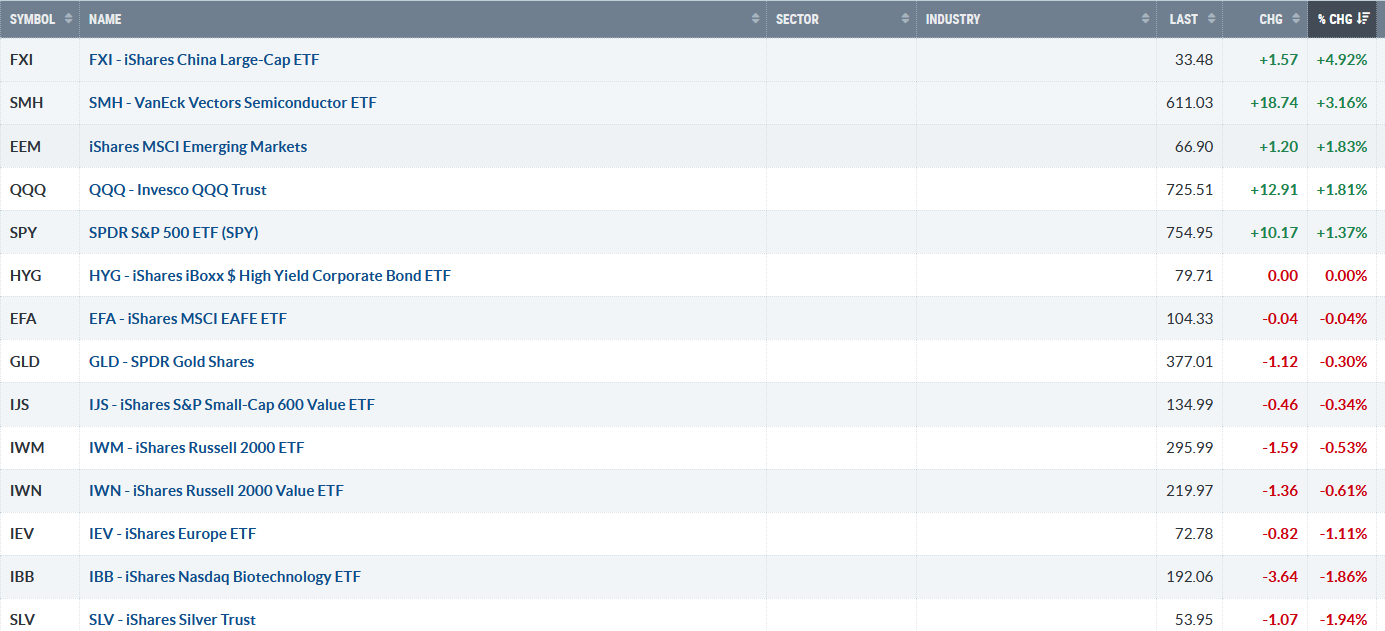
Figure 2: Bonnie’s ETFs Watch List Performance Summary 7/06/26-7/10/26
071026 Bonnie’s Weekly ETF Watch List
Source: Stockcharts.com
China showed improved relative strength last week after a prolonged period of underperformance. Silver, Biotechnology, Europe, Small Cap Growth, and Small Cap Value lagged last week and were all weaker than the S&P 500.
You will find more of Bonnie’s Market Charts HERE.
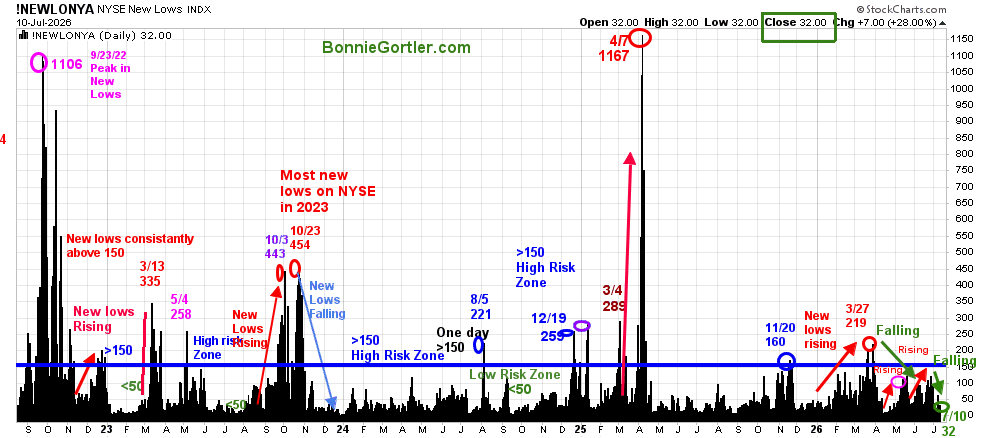
Figure 3: NYSE New Lows
071026 New Lows NYSE
Source: Stockcharts.com
On March 27, the New lows peaked at 219 on the New York Stock Exchange Index, entering the high-risk zone, and then immediately contracted in early April.
New Lows closed at 32 on 7/10/26, a low-risk zone. If new lows remain below 50, it would be positive. On the other hand, risk would rise if New Lows exceeded 150, which would be short-term negative.
Learn more about the significance of New Lows in my book, Journey to Wealth, published on Amazon. For a chapter preview of Journey To Wealth, visit here.
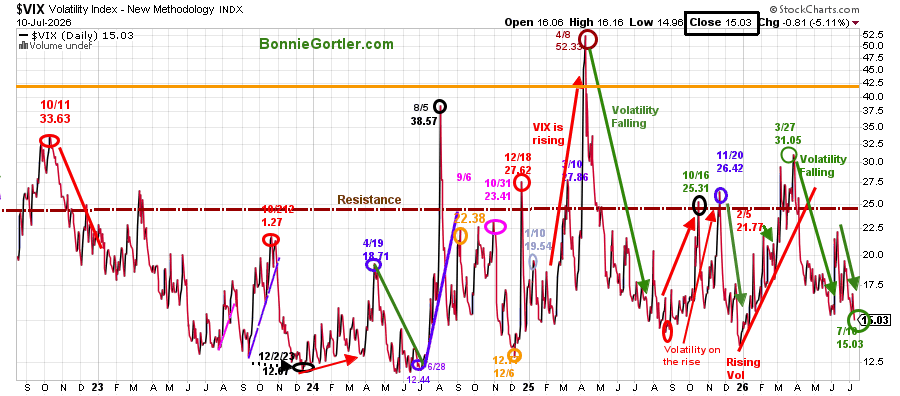
Figure 4: CBOE Volatility Index (VIX)
071026 $VIX
Source: Stockcharts.com
The CBOE Volatility Index (VIX), a measure of Fear, is trending lower. VIX fell to 15.03 last week, closing at its lowest level since January, implying low daily volatility and no serious decline is likely. Two closes above 25.00 would imply selling pressure in the short term and more daily volatility.
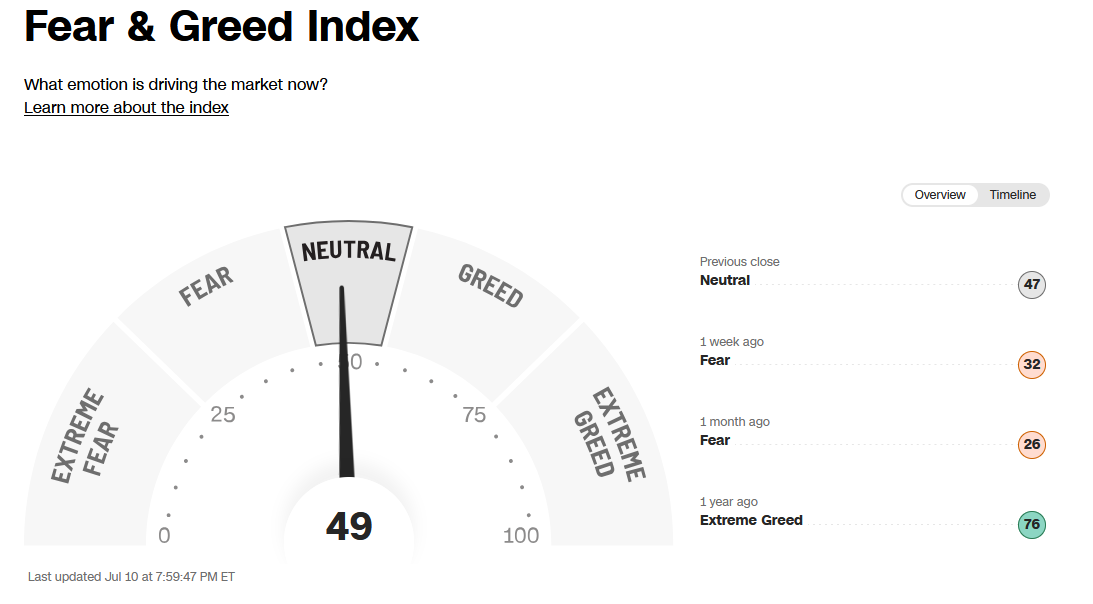
Figure 5: Fear & Greed Index
071026 CNN Fear and Greed Index
Source: CNN.com
The Fear and Greed Index, investor sentiment (a contrarian indicator), rose from a reading of 32 (Fear) the previous week to close at 49, a neutral reading.
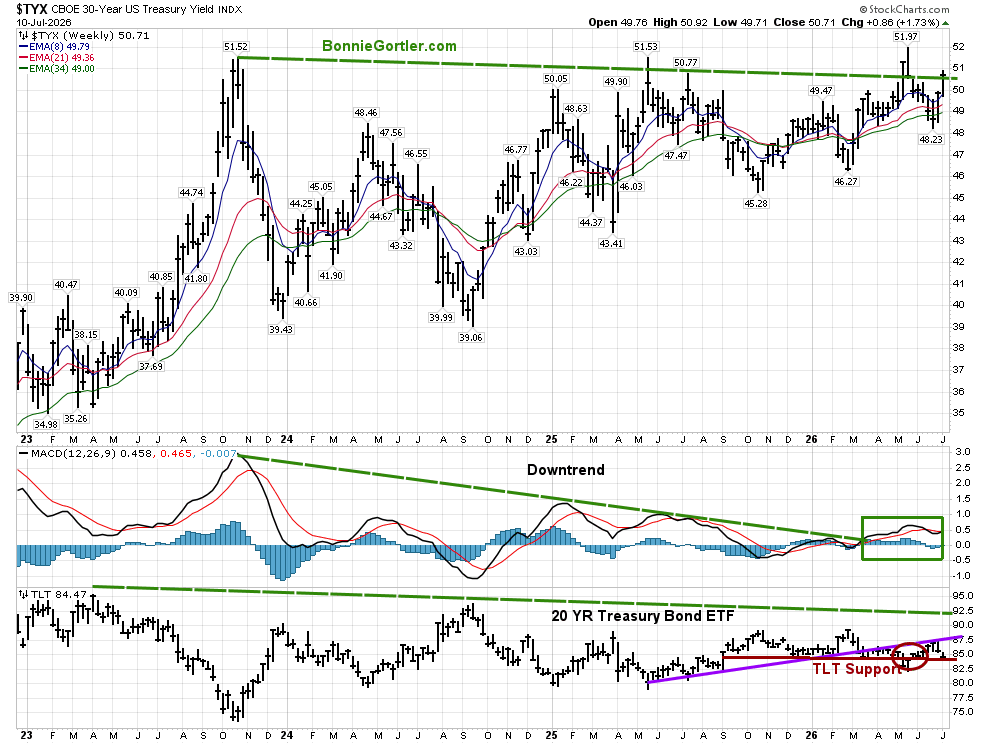
Figure 6: CBOE 30 YR U.S. Treasury Yield Weekly (Top),12-26-9 MACD (Middle), and 20 – YR Treasury Bond ETF (Bottom)
Source: Stockcharts.com
The Weekly 30-Year Treasury Yield (top chart) broke the downtrend from October 2023 in March 2026, then declined, and is now rising but remains below the May 2026 high.
The Weekly 20-Year Treasury Bond ETF (bottom chart) moves inversely to yields and is testing September 2025 support again.
If long-term yields continue to rise, equities could remain under pressure in the short term.
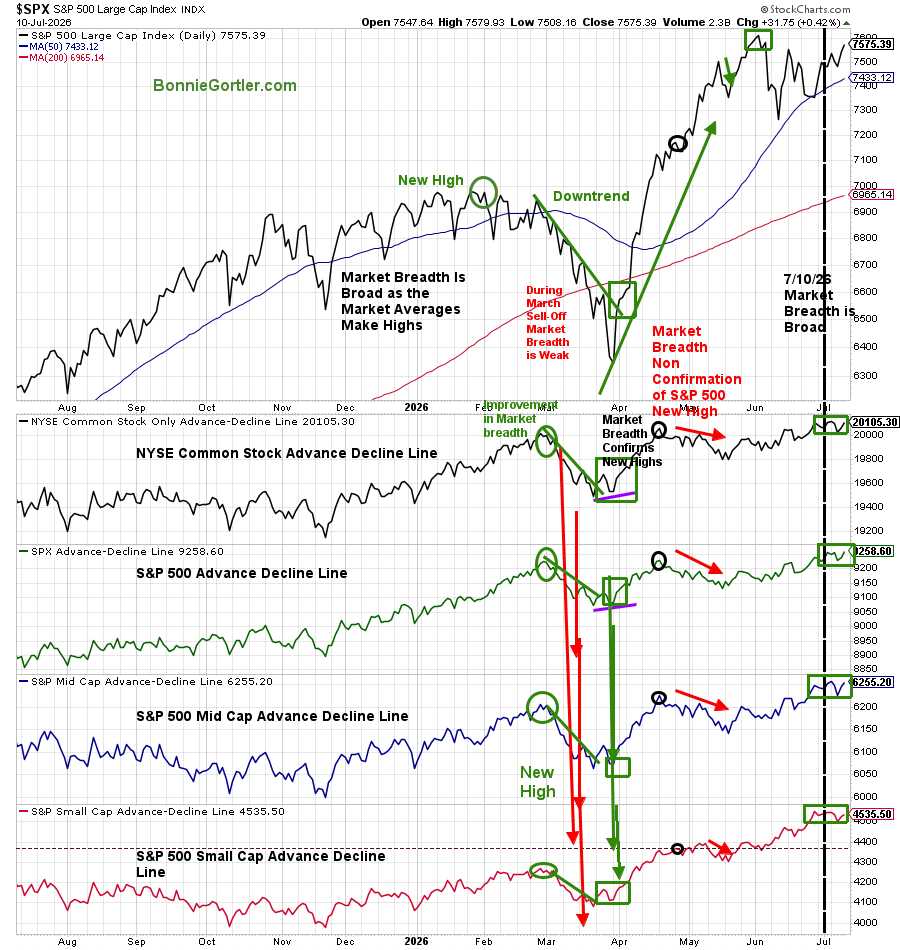
Figure 7: S&P 500 Price and NYSE, SPX, Mid and Small Cap AD Lines
071026 $SPX Index and Advance Decline lines of NYSE SML MID
Source: Stockcharts.com
The S&P 500 made a new high in May, with unconfirmed market breadth, as measured by the Advance-Decline Line of the NYSE Common Stock Index, the S&P 500, and the S&P Mid and Small Cap Index (red arrows).
Market breadth has strengthened as the S&P 500 has continued moving higher since June.
Keep a close eye on market breadth. As long as it remains strong, it continues to support higher stock prices. Weakening breadth would suggest increasing caution.
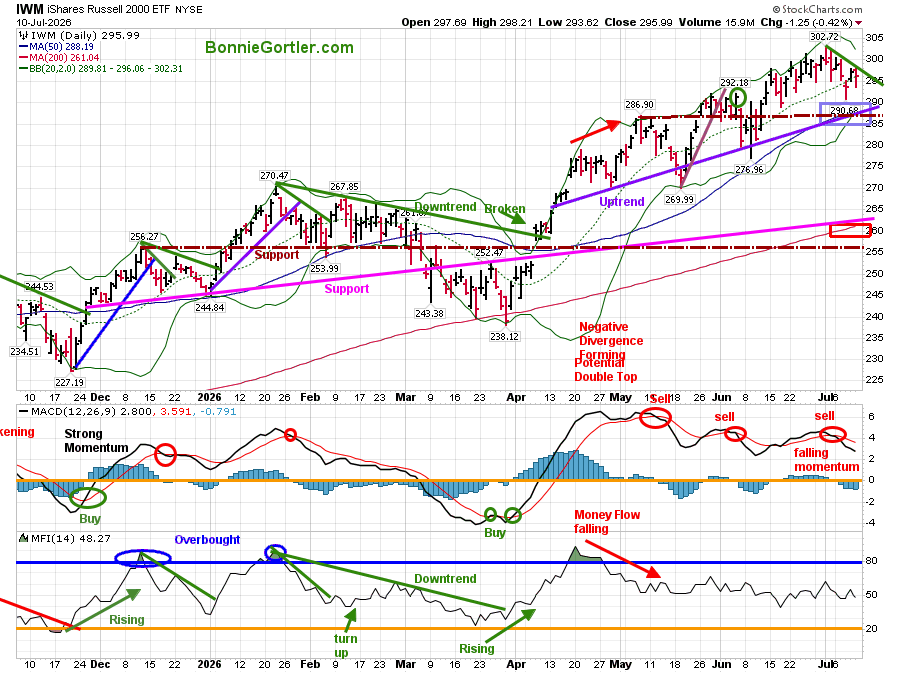
Figure 8: Daily iShares Russell 2000 (IWM) Price (Top),12-26-9 MACD (Middle), and Money Flow (Bottom)
071026 IWM Daily
Source: Stockcharts.com
IWM broke the daily downtrend in January (green line) and has moved sharply higher.
IWM closed above its 50-day Moving Average (blue rectangle) and the 200-day MA (red rectangle), a constructive technical pattern.
Last week, the Russell 2000 (IWM) closed at 295.99, down -0.53%, for the week. Support is at 288.00, 276.00, and 265.00. Resistance is at 299.00 and 303.00.
The MACD (middle chart) is on a sell and has generated repeated sell signals. Momentum is falling, not yet below 0, becoming oversold.
The Money Flow (lower chart) has been moving sideways, with no sign of buying interest.
With yields rising and MACD remaining on a sell signal, there is not yet a high-probability buying setup. IWM could continue to decline towards support at 288.00, then 276.00. An upside reversal through resistance at 303.00 would be positive.
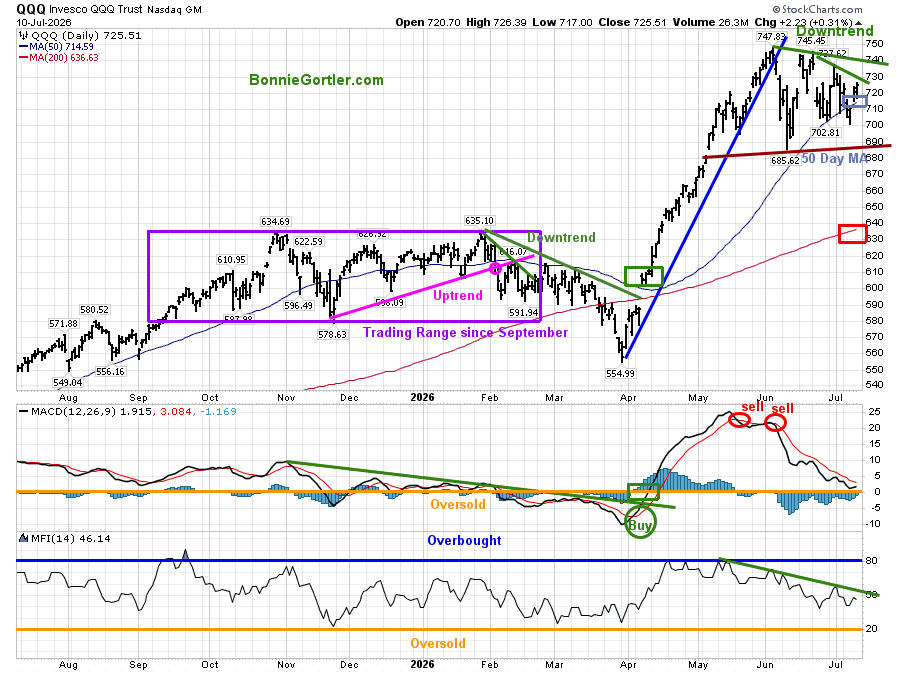
Figure 9: QQQ Daily Invesco QQQ Trust (QQQ) Price (Top),12-26-9 MACD (Middle), and Money Flow (Bottom)
071026 QQQ Daily
Source: Stockcharts.com
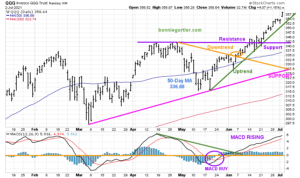
The Daily chart shows Invesco QQQ (QQQ), an exchange-traded fund that tracks the Nasdaq-100 Index. QQQ broke its daily (blue line) and intermediate uptrend from March 2026.
QQQ rose +1.81% last week, closing above its 50-day Moving Average (blue rectangle) and remaining well above its 200-day MA (red rectangle), an encouraging sign in the short term.
The MACD (middle chart) had strong momentum during the explosive March advance, but then it turned down from an extreme overbought reading, generating repeated sell signals. It is now working off its overbought condition, just missing a drop below 0. MACD turned higher last week, suggesting momentum may be improving.
Money Flow (MFI bottom chart) has trended lower since May and is now close to breaking out of the downtrend.
Support is at 714.00, 696.00, followed by 686.00. Resistance is at 727.00 and 745.00. It would be positive in the short term if QQQ breaks the June downtrend, closes above 727.00, and continues higher to a new high.
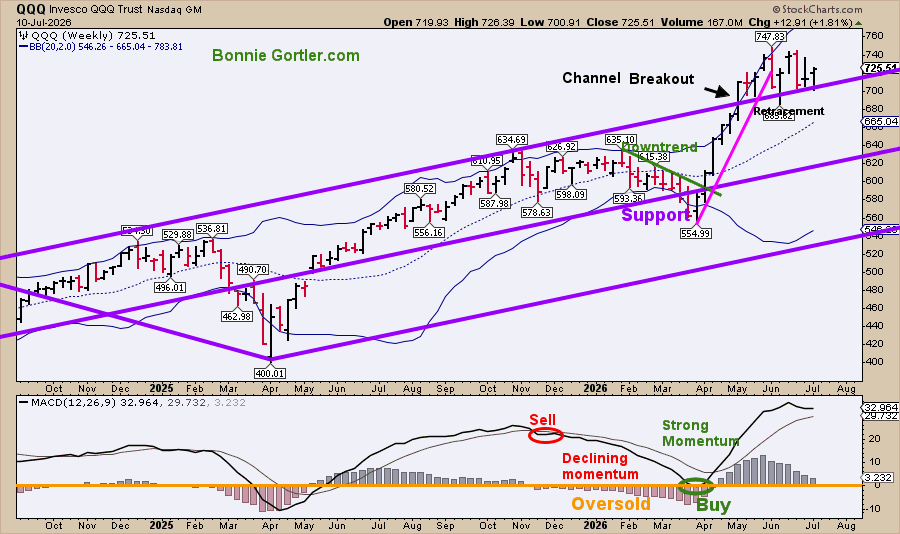
Figure 10: QQQ Weekly Invesco QQQ Trust (QQQ) Price (top) and 12-26-9 MACD Bottom)
071026 QQQ Weekly
Source: Stockcharts.com
QQQ broke out of its channel in April. The upside objective to 790.00 remains. A close below 660.00 would negate the upside objective.
MACD remains on an intermediate buy signal.
Summing Up:
Tops take longer to form than bottoms. MACD has confirmed the high in QQQ. A period of consolidation appears to have occurred, retracing the intermediate channel breakout, which so far is intact.
Semiconductors (SMH) Show Strength
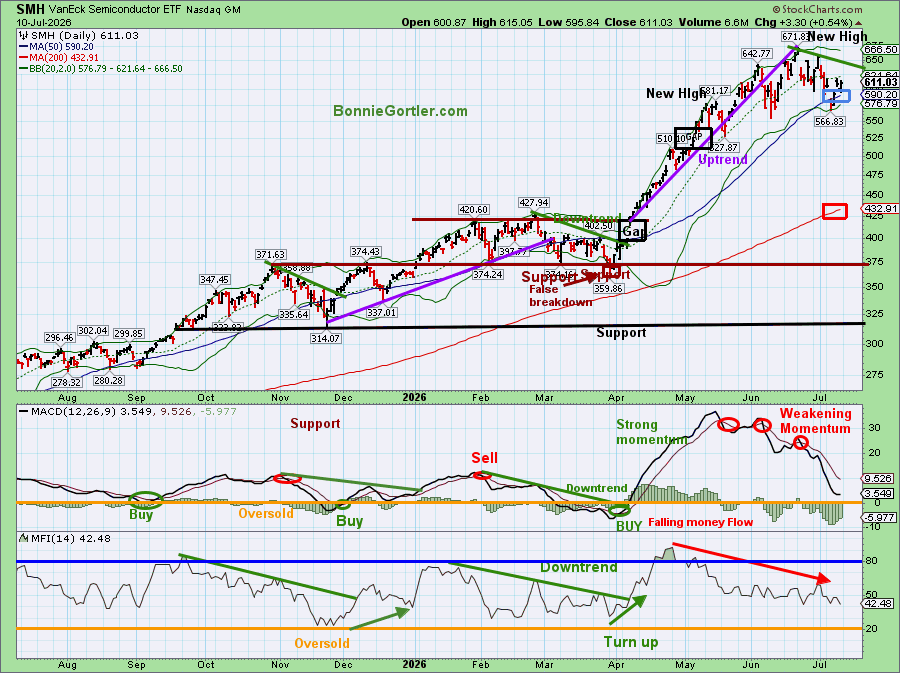
Figure 11: Daily Semiconductors (SMH)
071026 SMH Daily
Source: Stockcharts.com
The top chart shows the Daily Semiconductor (SMH) ETF, which is concentrated mainly in US-based Mega-Cap Semiconductor companies. SMH can be highly volatile. SMH tends to be a leading indicator of the market when investors are willing to take on greater risk, and the opposite is true when the market is falling.
SMH rose +3.16% last week, closing above its 50-day Moving Average (blue rectangle), and 200-day MA (red rectangle), a positive longer-term setup.
MACD (middle chart) remains in a sell signal, weakening momentum since May. The retracement is not quite enough for MACD to be oversold below 0 in position for a buy.
Money Flow (MFI bottom chart) peaked in April as SMH made a new high. However, MFI has continued to fall, a sign that money rotated out of Semiconductor stocks. Keep an eye out for Money Flow; if it turns up, and buying begins again.
Support is at 595.00, 566.00, 556.00, and 510.00. Resistance is at 620.00 and 660.00.
SMH acted better towards the end of the week. The weak momentum has started to wane. Watch SMH closely. If support holds near 595.00 or SMH breaks above resistance at 620.00, semiconductors could resume leadership and provide another positive signal for the broader market.
Summing Up:
Continue monitoring long-term bond yields. They remain one of the most important indicators to watch. Market breadth continues to support higher prices, and New Lows on the New York Stock Exchange remain in a low-risk zone.
Continue watching Technology, Semiconductors, and Small Caps. If these leadership groups strengthen while bond yields stabilize, the market could continue moving to new highs. On the other hand, if leadership weakens and yields continue to rise, expect volatility to increase and manage risk accordingly.
Rather than trying to predict every market move, focus on following your trading and investment plan while managing risk. Review your portfolio to determine whether you are overexposed to any one sector and whether adjustments are needed. Manage your risk, and your wealth will grow.
If you would like to discuss charts and get to know each other better, schedule your Free 30-minute Wealth-Building Strategy Session today. Register Here.





“Protect your health the way you protect your portfolio. Both are investments in your future.”-
Bonnie Gortler




Discover how to quickly create more well-being in your life with these simple strategies.
As an added bonus you will also
receive BG’s Updates and Ezine