

10 Simple Tips for Financial Well-Being
07/01/2026
Equity market overview—bullish developments remain in place
The stock market has been extremely resilient, filled with enthusiasm since the presidential election. Major averages have made new all-time highs on a regular basis. Market breadth has been mixed from day to day, with Nasdaq breadth not yet confirming the highs in the Nasdaq Composite. Whenever potential warning signals show up (such as weakening momentum or unnerving world news events) and the market looks like it might be ready to fall, instead the bulls step in to buy and the market rebounds.
 Technology has been the star performer, continuing to charge ahead, leading the advance outperforming the other major averages. Overseas markets have joined the party, high yield bonds remain firm, and VIX (a measure of fear) is near its lows. All of these are signs of a healthy market. Our models remain overall neutral-positive. The intermediate and long-term trend remains up. There is no evidence of a change in trend until proven otherwise. Review my last Systems and Forecasts article dated 05/25/17 for 11 clues you want to watch for a potential trend change. The trend is your friend so why fight it.
Let’s turn now to an area where we haven’t talked about in a long time—Gold. You can trade gold bullion with the SPDR Gold Shares ETF (GLD). The charts suggest that gold now appears ready to shine.
It is easy to trade gold bullion using the SPDR Gold Shares ETF (GLD)
 GLD has a relatively low expense ratio of 0.40 and, like the physical metal, is 1.43 times more volatile than the S&P 500 (SPY). Investing in commodities entails significant risk and is not appropriate for all investors. GLD, for the most part, is not usually whippy; it tends to be trendy, with its price moving steadily in the same direction for extended periods. After GLD establishes a trend, it could remain in that trend for many months or years at a time. Gold (GLD) appears now to be at a critical juncture that could represent the early stage of a long term rally.
SPDR GOLD TRUST (GLD) WEEKLY (ETF) and 12-26-9 MACD
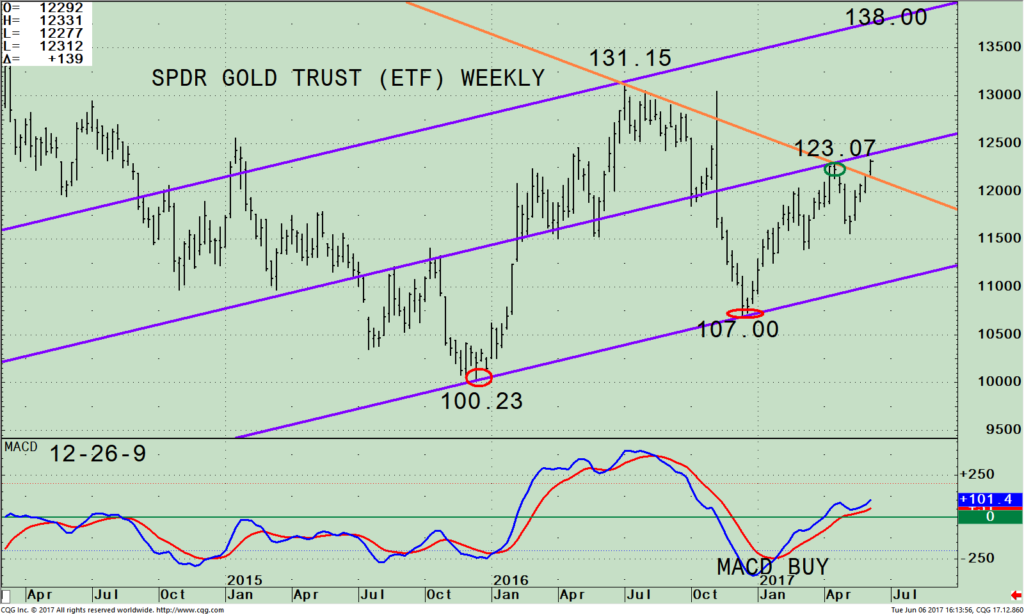
The top portion of the GLD chart above shows the weekly active trend channel in effect (blue lines). Purchasing the GLD is an easy way to participate without holding the physical commodity.
Gold (GLD) bottomed on 12/07/15 at 100.23 after years of decline, being out of favor by investors. A sharp rally followed, before GLD fell again, retracing most of its gains and bottoming at 107.00 on 12/15/16. Since hitting bottom last December, GLD has traced out a series of higher low and higher highs. This week GLD penetrated the high on 04/17/17 at 123.07 and has now broken its downtrend from its peak (orange line) from 07/05/16. There is more room for further price gains, especially if GLD can penetrate the middle channel. A break above 125.00 would suggest a potential upside target to 138.00.
The lower portion of the chart is the 12-26-9 MACD, a momentum indicator. MACD had a timely entry from an extreme oversold condition. Only recently has MACD turned positive. There is plenty of room to the upside before MACD will be in an overbought condition. MACD is still rising, showing no signs of weakness. The trend of gold has improved. With equities at new highs, now could be a good time for investors to add some diversification to your portfolio into a sector where the trend has turned favorable, before further interest from other investors and institutions.
SPDR GOLD TRUST (GLD) MONTHLY (ETF) and 12-26-9 MACD
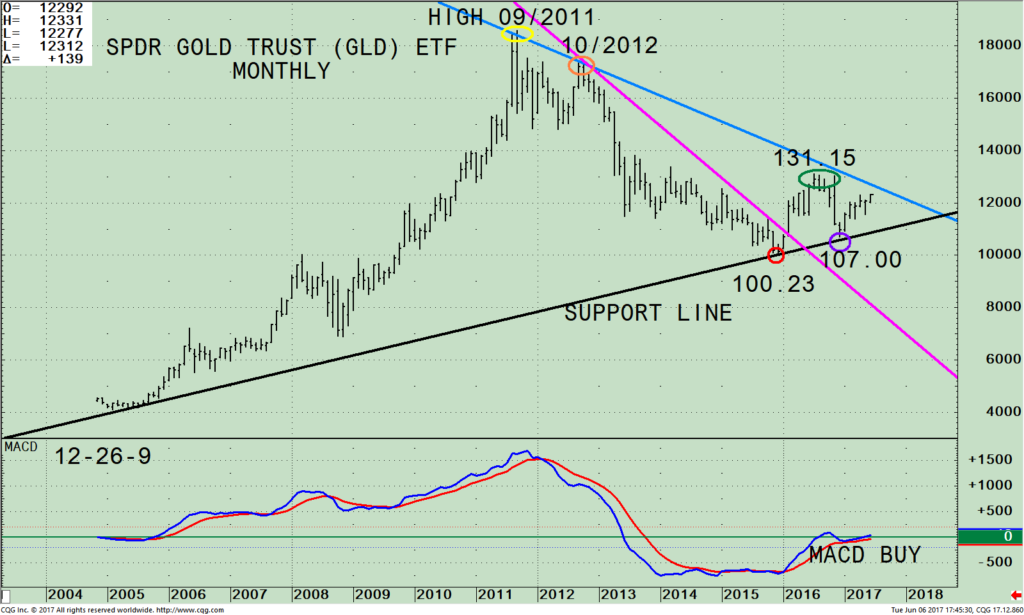
The top portion shows the SPDR Gold Trust (GLD) monthly (ETF) chart. GLD has been out of favor for many years. GLD peaked in September 2011 (yellow circle). Investors are more optimistic about the precious metal and it’s up 12.5% this year through 06/06/17. After breaking the shorter term monthly downtrend (pink line), GLD had a brief rally but didn’t have enough strength to break the longer term downtrend from the September 2011 high (blue line). Most times after weakness prevails for long periods of time, the first rally attempt normally is unsuccessful and not sustainable to continue. Another test of the low is required. The second attempt tends to be a safer, profitable and more sustainable. GLD appears to have made a successful test of the low. For those of you who are willing to take the risk, I recommend adding GLD to diversify your portfolio, using 107.00 on a close as a stop.
The lower portion of the chart is the 12-26-9 MACD, a momentum indicator. MACD has been oversold since June 2013, below 0, now on a buy and gaining strength. Gold is looking more appealing and it is also gaining some relative strength against the SPY. There is a good chance if GLD does indeed move higher you can expect additional money to flow into this sector from investors and institutions to fuel a further advance. It would be bullish if GLD breaks above 125.00, (the same as the weekly chart), which would break the monthly downtrend from 2011 (blue line) and then penetrates 131.15, the July 2016 high.
Summing Up:
Our models remain overall neutral-positive. The stock market remains resilient and continues to work its way higher with the bulls in control. There is no evidence of a change in trend until proven otherwise. An area out of favor with investors appears ready to shine. GLD appears to have made a successful test of the low. A buying opportunity has developed in GLD on weekly and monthly charts. I recommend adding GLD to diversify your portfolio, using 107.00 on a close as a stop.
I would love to hear from you. Please call me at 516-829-6444 or email at bgortler@signalert.com to share your thoughts or ask me any questions you might have.

If you like this article, then you will love this!
Free Instant Access to
Grow Your Wealth and Well-Being E-Book HERE
*******Article published by Bonnie Gortler in Systems and Forecasts June 08, 2017
Disclaimer: Although the information is made with a sincere effort for accuracy, it is not guaranteed that the information provided is a statement of fact. Nor can we guarantee the results of following any of the recommendations made herein. Readers are encouraged to meet with their own advisors to consider the suitability of investments for their own particular situations and for determination of their own risk levels. Past performance does not guarantee any future results.


Create more wealth in your life
with these simple strategies.
As an added bonus you will also
receive BG’s Updates and Ezine

Discover how to quickly create more well-being in your life with these simple strategies.
As an added bonus you will also
receive BG’s Updates and Ezine

As an added bonus you will receive BG’s Updates and Ezine

All work listed on BonnieGortler.com is licensed under a Creative Commons Attribution - Noncommercial - No Derivative Works 3.0 Unported License.


Free Report:
Grow and Sustain Your Wealth
Discover how to grow your money with these easy, simple steps.

