


10 Simple Tips for Financial Well-Being
07/01/2026
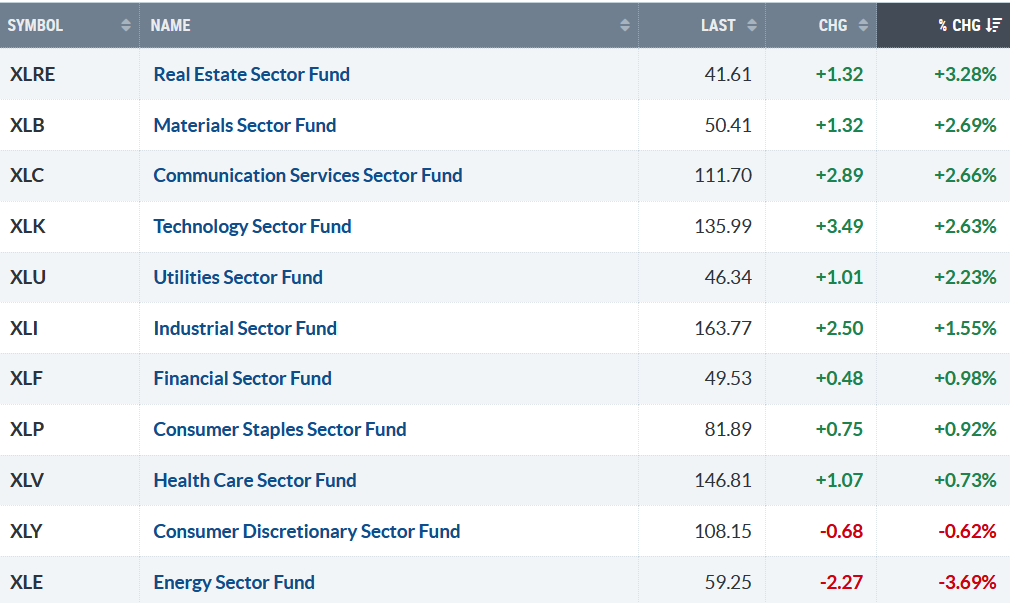
High volatility continues in April. Nine of the eleven S&P SPDR sectors were higher last week in shortened holiday trading. Real Estate (XLRE) and Materials were the strongest, while Consumer Discretionary (XLY) and Energy (XLE) were the weakest. The SPDR S&P 500 ETF Trust (SPY) rose +1.66%.
S&P SPDR Sector ETFs Performance Summary 3/26/26-4/2/26
040226 March SPDR Sectors
Source: Stockcharts.com
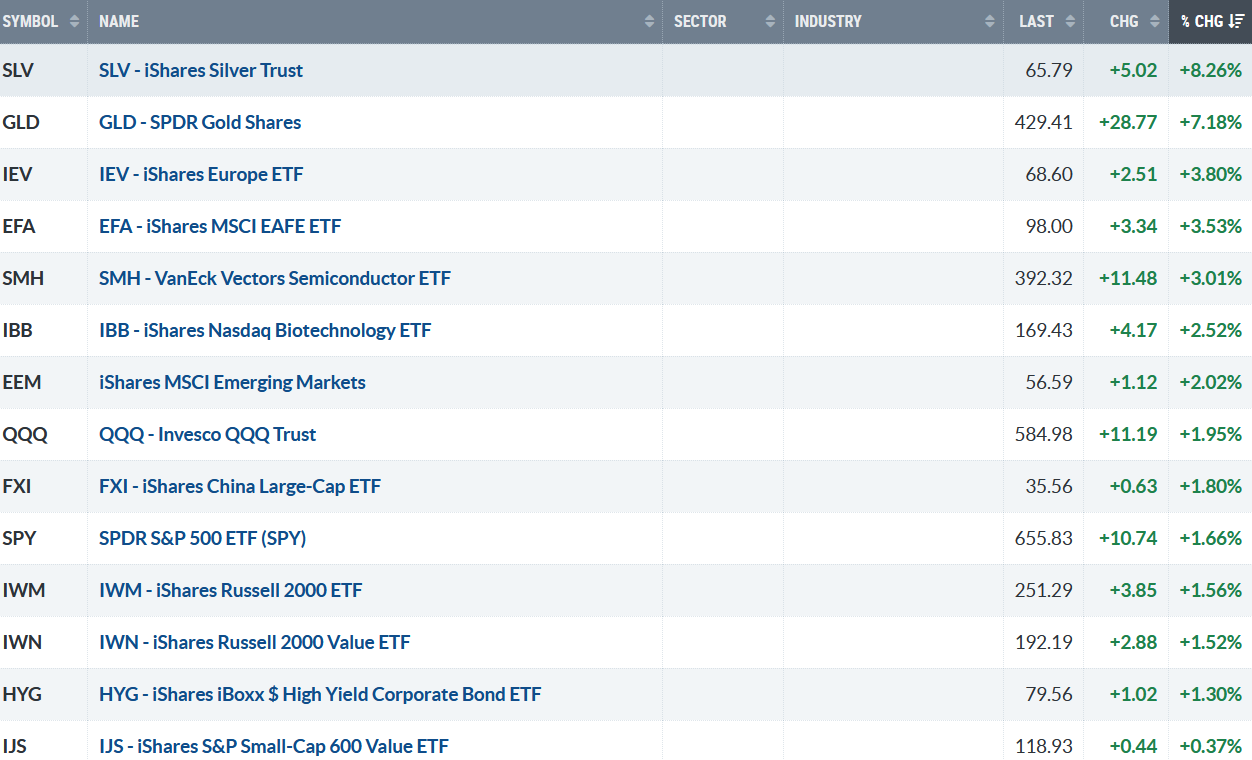
Figure 2: Bonnie’s ETFs Watch List Performance Summary 3/26/26-4/2/26
Source: Stockcharts.com
Silver and Gold led. Semiconductors, Biotechnology, Emerging Markets, Technology, and China outperformed the S&P 500, while Small Cap Growth and Value lagged the S&P 500.
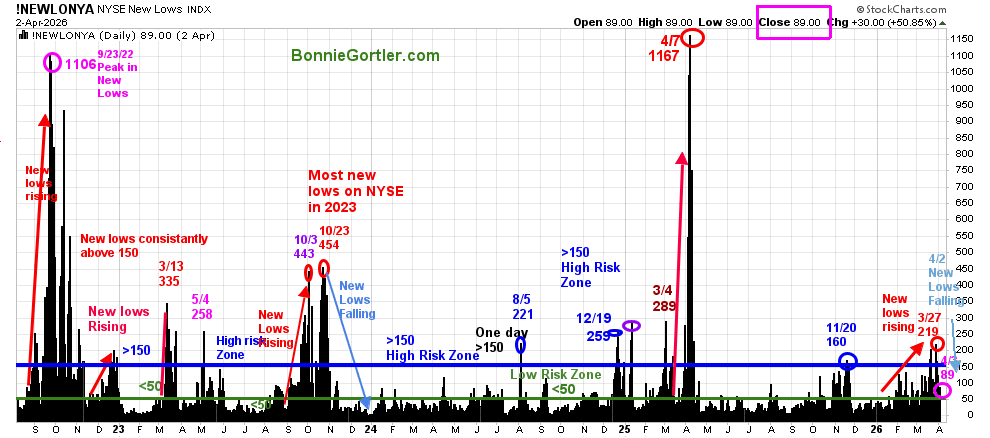
Figure 3: NYSE New Lows
040226 NYSE New Lows
Source: Stockcharts.com
After reaching 219, New Lows on the New York Stock Exchange Index on 3/27/26, the high-risk zone, New Lows contracted to close at 89 on 4/2, a positive sign.
It would be positive if New Lows continued to fall below 50. On the other hand, if new lows continue to increase above 150, it would be short-term negative.
Learn more about the significance of New Lows in my book, Journey to Wealth, published on Amazon. For a chapter preview of Journey To Wealth, visit here.
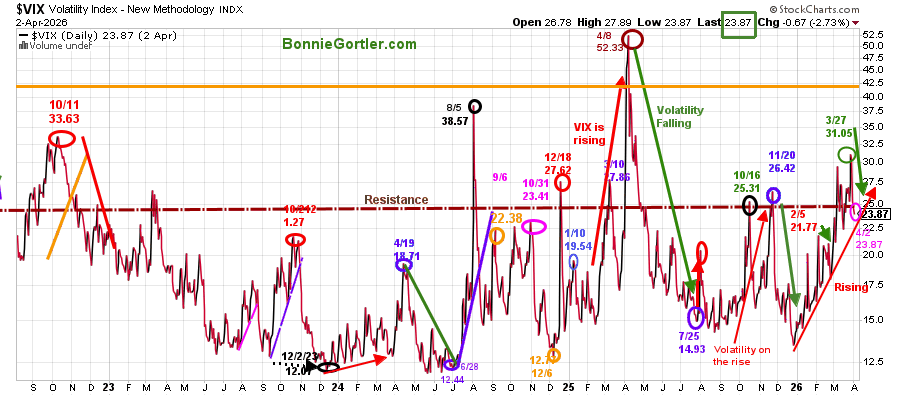
Figure 4: CBOE Volatility Index (VIX)
040226 VIX
Source: Stockcharts.com
The CBOE Volatility Index (VIX), a measure of Fear, has been trending higher in 2026. Last week VIX fell from 31.05 to close at 23.87. A continued contraction in volatility would imply the worst of the decline is over. On the other hand, two closes above 31.05 would imply selling pressure in the short term to return.
You will find more of Bonnie’s market charts HERE.
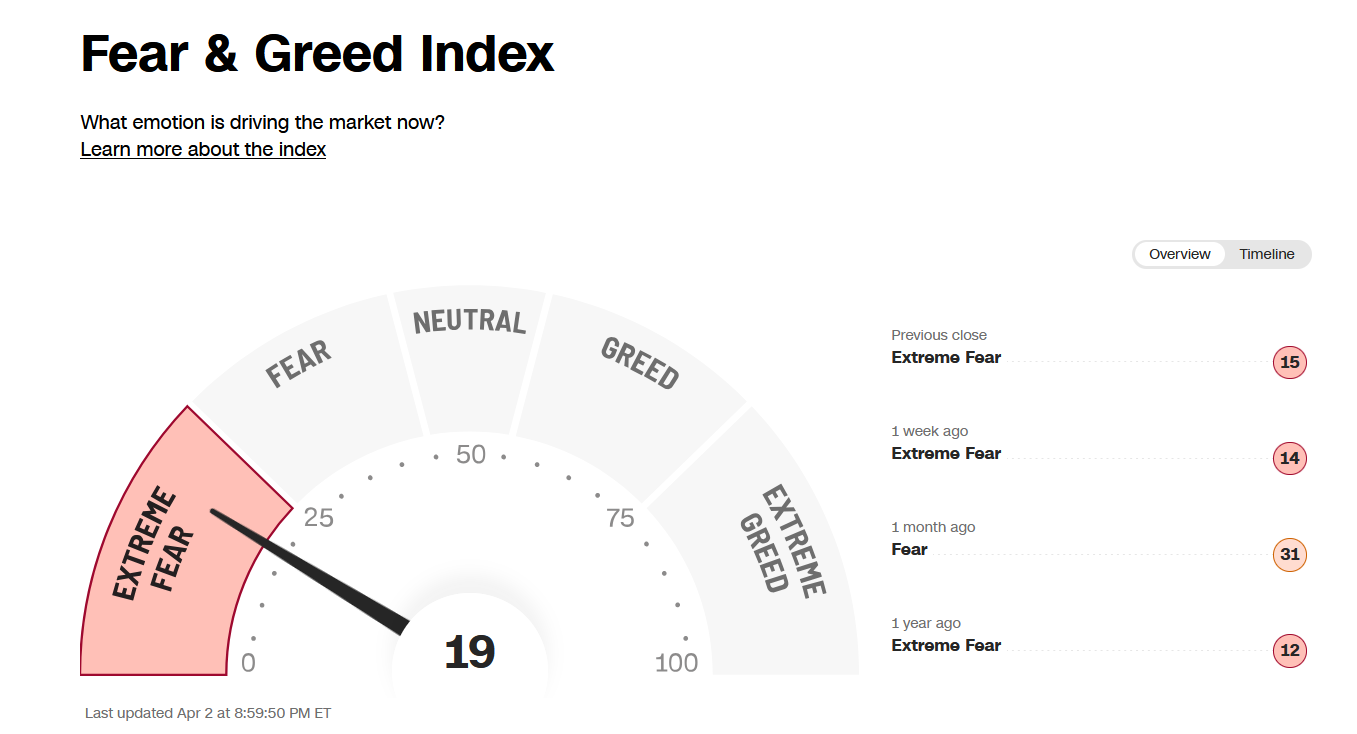
Figure 5: Fear & Greed Index
040226 Fear and Greed Index
Source: CNN.com
With the recent pullback, investor sentiment, as measured by the Fear and Greed Index (a contrarian indicator), has fallen to Extreme Fear, a level where buying opportunities arise.
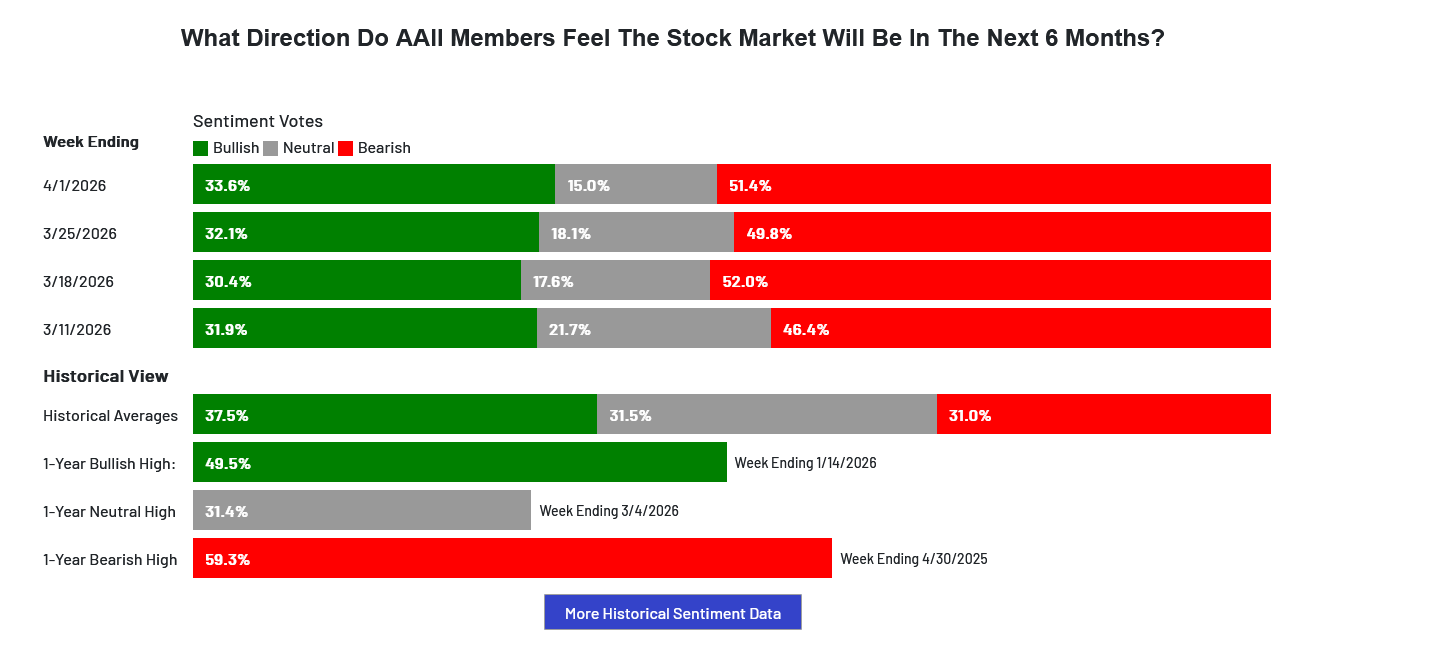
Figure 6: AAII Investor Sentiment Survey
040226 AAII Investment Sentiment
Source: AAII Investor Sentiment Week Ending 4/01/2026
In the latest AAII Sentiment Survey, bullish sentiment is 33.6% below its historical average of 37.5% for the seventh consecutive week. Bearish sentiment is 51.4%, unusually high and above its historical average of 31.0%, for the eighth consecutive week. Neutral sentiment is 15.0%, unusually low, and is below its historical average.
In Sum:
Market Sentiment is a contrarian indicator. With AAII showing a high bearish reading and Fear and Greed showing Extreme Fear, a market bottom with buying opportunities is likely sooner rather than later.
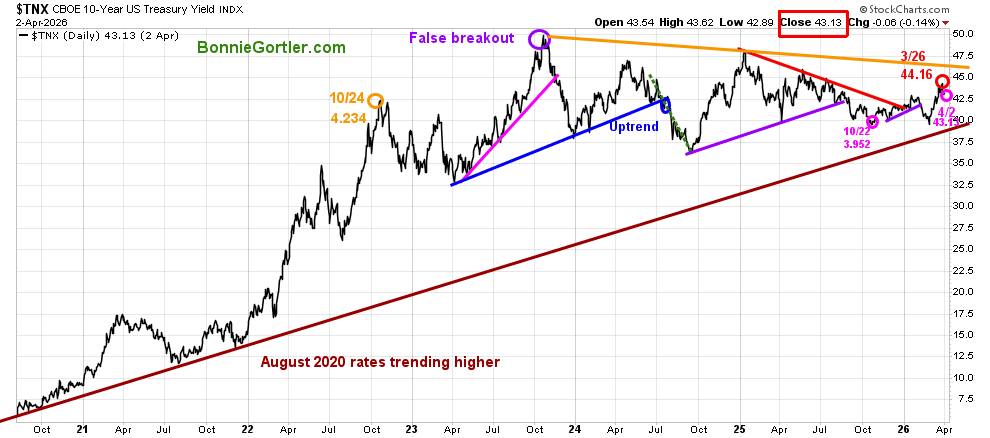
Figure 7: CBOE 10YR U.S. Treasury Yield Daily
040226$TNX – CBOE 10-Year US Treasury Yield
Source: Stockcharts.com
The long-term yield uptrend in 10-year U.S. Treasuries, which began in August 2020, appeared poised to break, but it reversed sharply to the upside. However, after peaking on 3/26, yields declined from 4.416% to close at 4.313%. If yields continue to fall below 3.950%, it will likely support equities. On the other hand, if yields close above 4.50%, it could put pressure on equities in the short term.
040226 Charting Strategies to Cut Risk and Trade with the Trend.
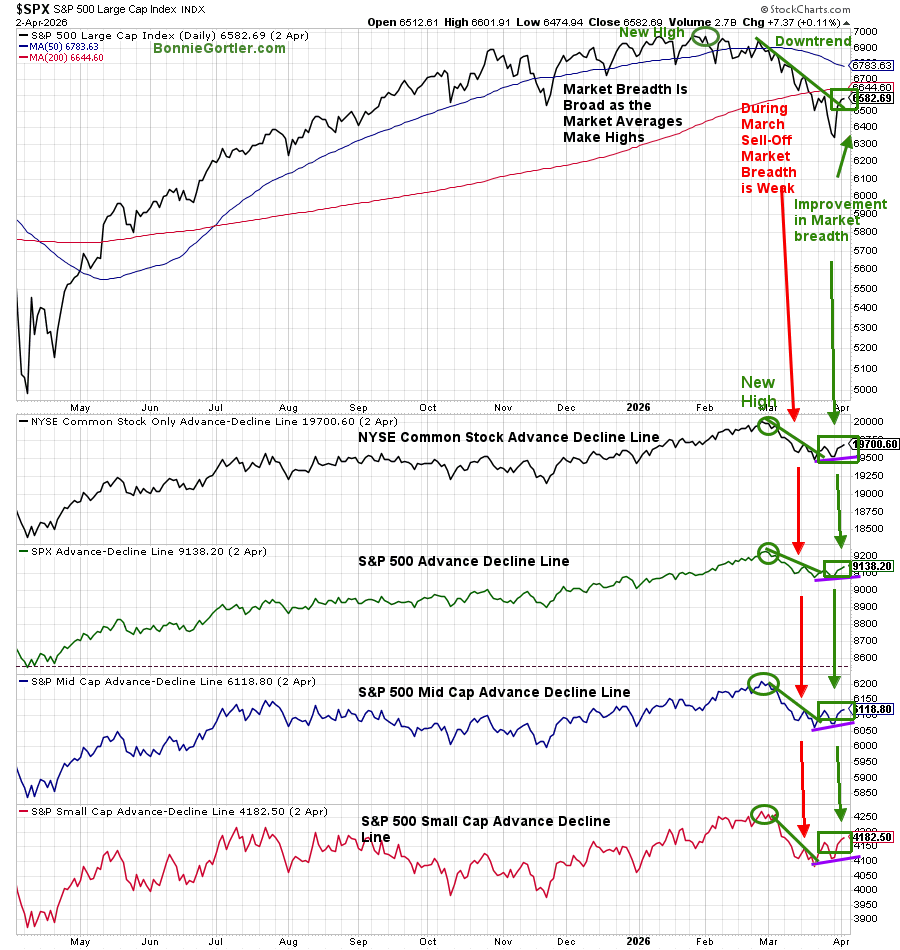
Figure 8: S&P 500 Price and NYSE, SPX, Mid and Small Cap AD Lines
040226 S&P 500 Price and NYSE, SPX, Mid and Small Cap AD Lines
Source: Stockcharts.com
Market breadth on last week’s rally was broad, a positive sign in the short term. The advance-decline line of the NYSE Common Stock Index, the S&P 500, and the S&P Mid and Small Cap indices rose with their related averages. Technically, it is exactly what you want to see after market weakness.
Keep a close eye on market breadth this week for clues on whether the rally continues in the short term or falters.
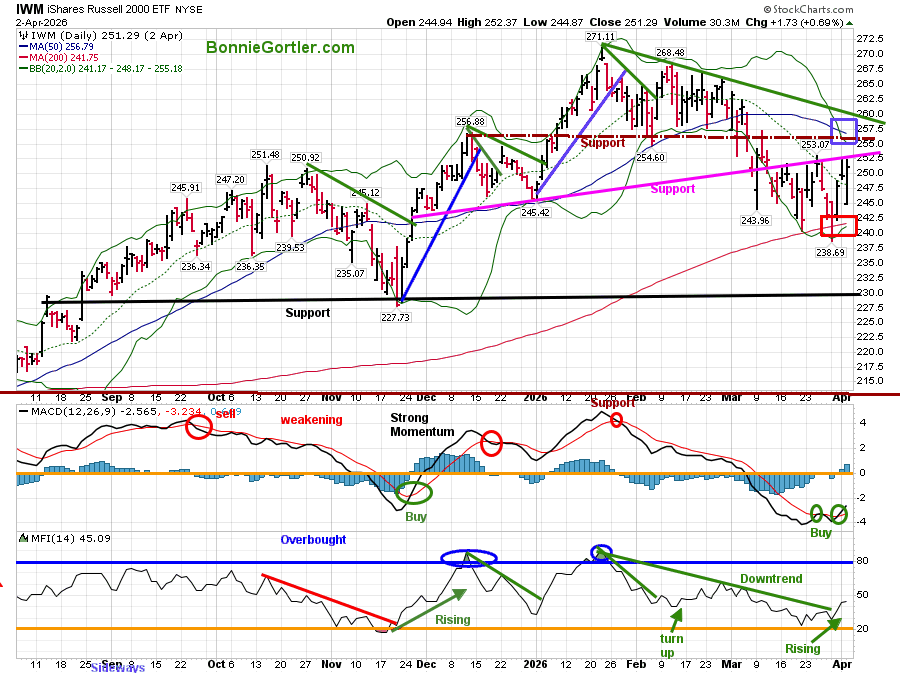
Figure 9: Daily iShares Russell 2000 (IWM) Price (Top),12-26-9 MACD (Middle), and Money Flow (Bottom)
040226 IWM Daily
Source: Stockcharts.com
The Russell 2000 (IWM) closed at 251.29, up +3.37% for the week (3/27-4/2).
Despite the rise, IWM remains in a daily downtrend from January 2026 (green line) and an intermediate downtrend (chart not shown).
IWM closed below its 50-day Moving Average (blue rectangle), a sign of weakness, but it’s positive that IWM closed above the 200-day MA (red rectangle) after falling below it.
The MACD (middle chart) generated a repeat buy signal last week, oversold below 0, and is rising.
The Money Flow (lower chart) is rising and has broken the January downtrend as investors have stepped in to buy, which is positive.
Learn charting strategies to help your short and intermediate trading in the comfort of your home in my eCourse, Wealth Through Investing Made Simple. New Module 7: Trading Alerts That Build Confidence and Reduce Risk. Learn more here.
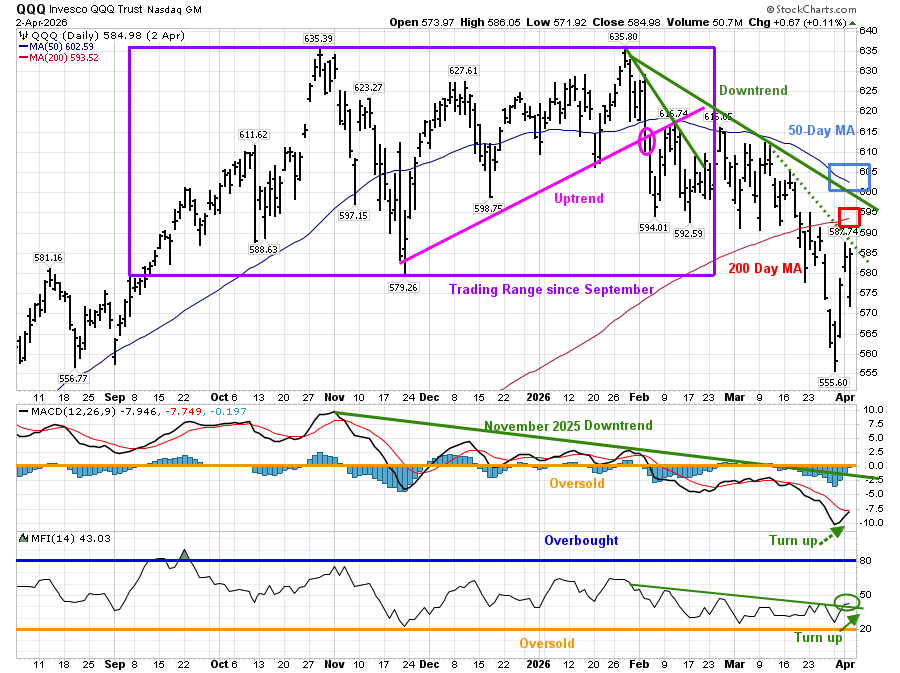
Figure 10: QQQ Daily Invesco QQQ Trust (QQQ) Price (Top),12-26-9 MACD (Middle), and Money Flow (Bottom)
040226 QQQ Daily
Source: Stockcharts.com
The Daily chart shows the Invesco (QQQ), an exchange-traded fund based on the Nasdaq 100 Index. QQQ gained +3.98% last week (3/27-4/2), despite high volatility.
QQQ remains in a daily downtrend from January 2026 (green line) and an intermediate downtrend (chart not shown). QQQ closed below its 50-day Moving Average (blue rectangle) and below its 200-day MA (red rectangle), a sign of weakness.
Momentum (MACD, middle chart) remains in a downtrend from November, is extremely oversold, has turned up, but has not yet generated a buy signal; it is likely to do so soon.
Money Flow (MFI bottom chart) has turned up and on Friday broke the January downtrend, an encouraging sign.
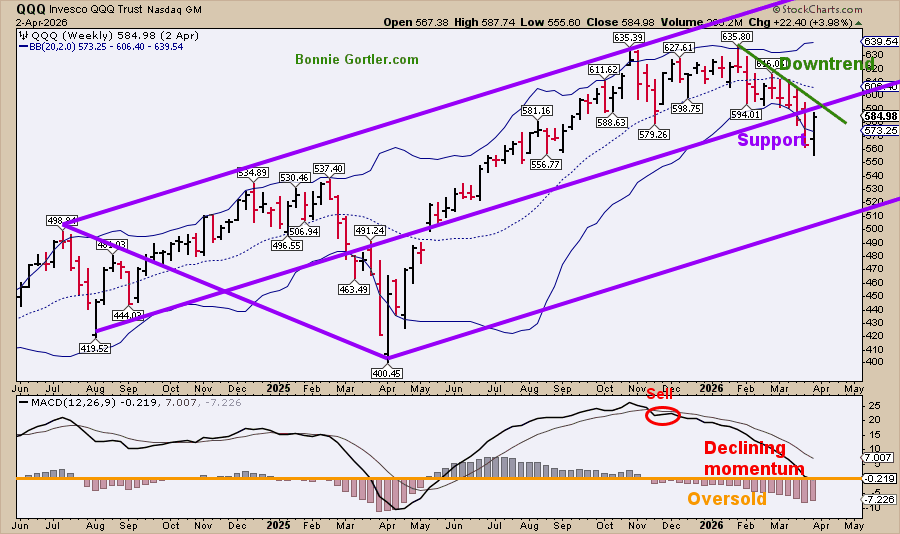
Figure 11: QQQ Weekly Invesco QQQ Trust (QQQ) Price (top) and 12-26-9 MACD Bottom)
040226 QQQ Weekly Channel
Source: Stockcharts.com
QQQ remains in an intermediate downtrend as QQQ continues to make lower highs and lower lows, a negative pattern.
QQQ, despite last week’s gains, closed under price support at the middle channel, on declining momentum, oversold, below 0, but now closer to generating an intermediate buy signal.
QQQ closed in the upper range for the week. With both the daily and weekly charts in downtrends, the risk of a further decline remains.
Another test of the lows or more base building is necessary for a lower-risk entry.
Figure 12: Daily Semiconductors (SMH)
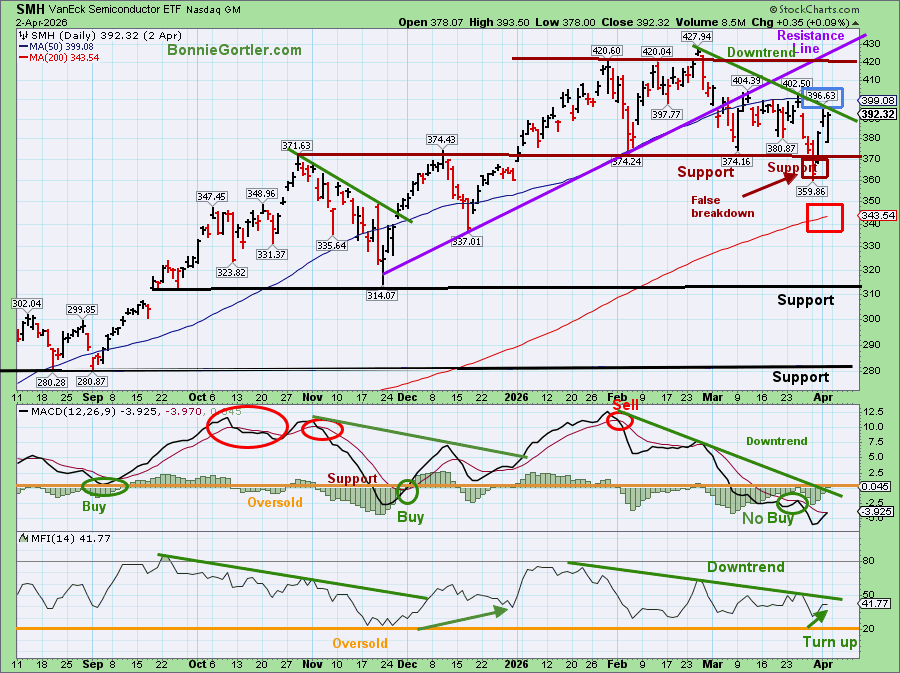
040226 SMH Daily
Source: Stockcharts.com
The top chart shows the Daily Semiconductor (SMH) ETF, which is concentrated mainly in US-based Mega-Cap Semiconductor companies. SMH can be highly volatile. SMH tends to be a leading indicator of the market when investors are willing to take on greater risk, and the opposite is true when the market is falling.
A good week for SMH, gaining +4.83% last week (3/27-4/2). SMH closed near its high for the week yet remains in a daily downtrend from February 2026 (green line) and an intermediate downtrend (chart not shown). SMH closed below its 50-day Moving Average (blue rectangle), a sign of weakness, but above its 200-day MA (red rectangle).
Momentum (MACD, middle chart) remains on a sell signal, in a downtrend from January, and is extremely oversold, in position to trigger a fresh buy on any strength.
Money Flow (MFI bottom chart) has been in a downtrend since January, has turned up, and is close to breaking that downtrend, an encouraging sign that buyers are stepping in.
Support is at 378.00, followed by 370.00. Resistance is at 394.00, 400.00, followed by 421.00.
Sum Up:
Both the daily and weekly charts remain in downtrends. Watch SMH closely to see if support holds if it moves lower, or if it rallies and breaks through resistance, leading the market higher.
Conclusion:
The Dow, S&P 500, and Nasdaq were all higher last week, posting their biggest gains since November 2025, despite the war, oil prices rocketing higher, and so much uncertainty. Volatility remains high. Market breadth was impressive during what appears to be a relief rally, given the market’s oversold condition. A more meaningful rally will develop when the daily and intermediate downtrends break. Watch for leadership in Small Caps, Semiconductors, and Technology. Weakness in those areas and the expansion of New Lows on the New York Stock Exchange Index would imply further downside in the short term. Manage your risk, and your wealth will grow.
If you would like to talk about charts and get to know each other better, schedule your Free 30-minute Wealth Building Strategy Session today. Register Here.


Create more wealth in your life
with these simple strategies.
As an added bonus you will also
receive BG’s Updates and Ezine

Discover how to quickly create more well-being in your life with these simple strategies.
As an added bonus you will also
receive BG’s Updates and Ezine

As an added bonus you will receive BG’s Updates and Ezine

All work listed on BonnieGortler.com is licensed under a Creative Commons Attribution - Noncommercial - No Derivative Works 3.0 Unported License.


Free Report:
Grow and Sustain Your Wealth
Discover how to grow your money with these easy, simple steps.

